


Standardized frameworks play a fundamental role in leveling the playing field and setting the standard within the tech industry, ensuring that everyone has access to the same tools and practices. These frameworks promote best practices and foster innovation and collaboration across different sectors. One example of such a framework is OpenTelemetry, a project that has rapidly gained traction and continued to flourish as an open-source initiative under the Cloud Native Computing Foundation (CNCF). This project is dedicated to providing a unified set of tools for collecting and transferring telemetry data, such as traces, metrics, and logs, making it an indispensable resource in an observability toolset.
OpenTelemetry demystifies the process of observing applications, providing a cohesive approach to gathering and managing telemetry data. At its core, it offers a vendor-agnostic framework, allowing the collection of detailed application performance metrics and traces. Its significance lies in its ability to bring visibility into complex, distributed systems, enabling easier ways to diagnose and troubleshoot issues more effectively.
This blog post will guide you through instrumenting your Python application using the standard OpenTelemetry components and sending the telemetry data to Lumigo’s OpenTelemetry endpoint for analysis and monitoring.
Understanding OpenTelemetry
OpenTelemetry is a comprehensive set of software tools, APIs, and SDKs that help instrument, generate, collect, and export telemetry data, including metrics, logs, and traces. It provides an observability framework, enabling visibility into a deployed application’s operations. This toolset is designed to assist in monitoring applications and troubleshooting issues by providing in-depth insights into the system’s performance and behavior.
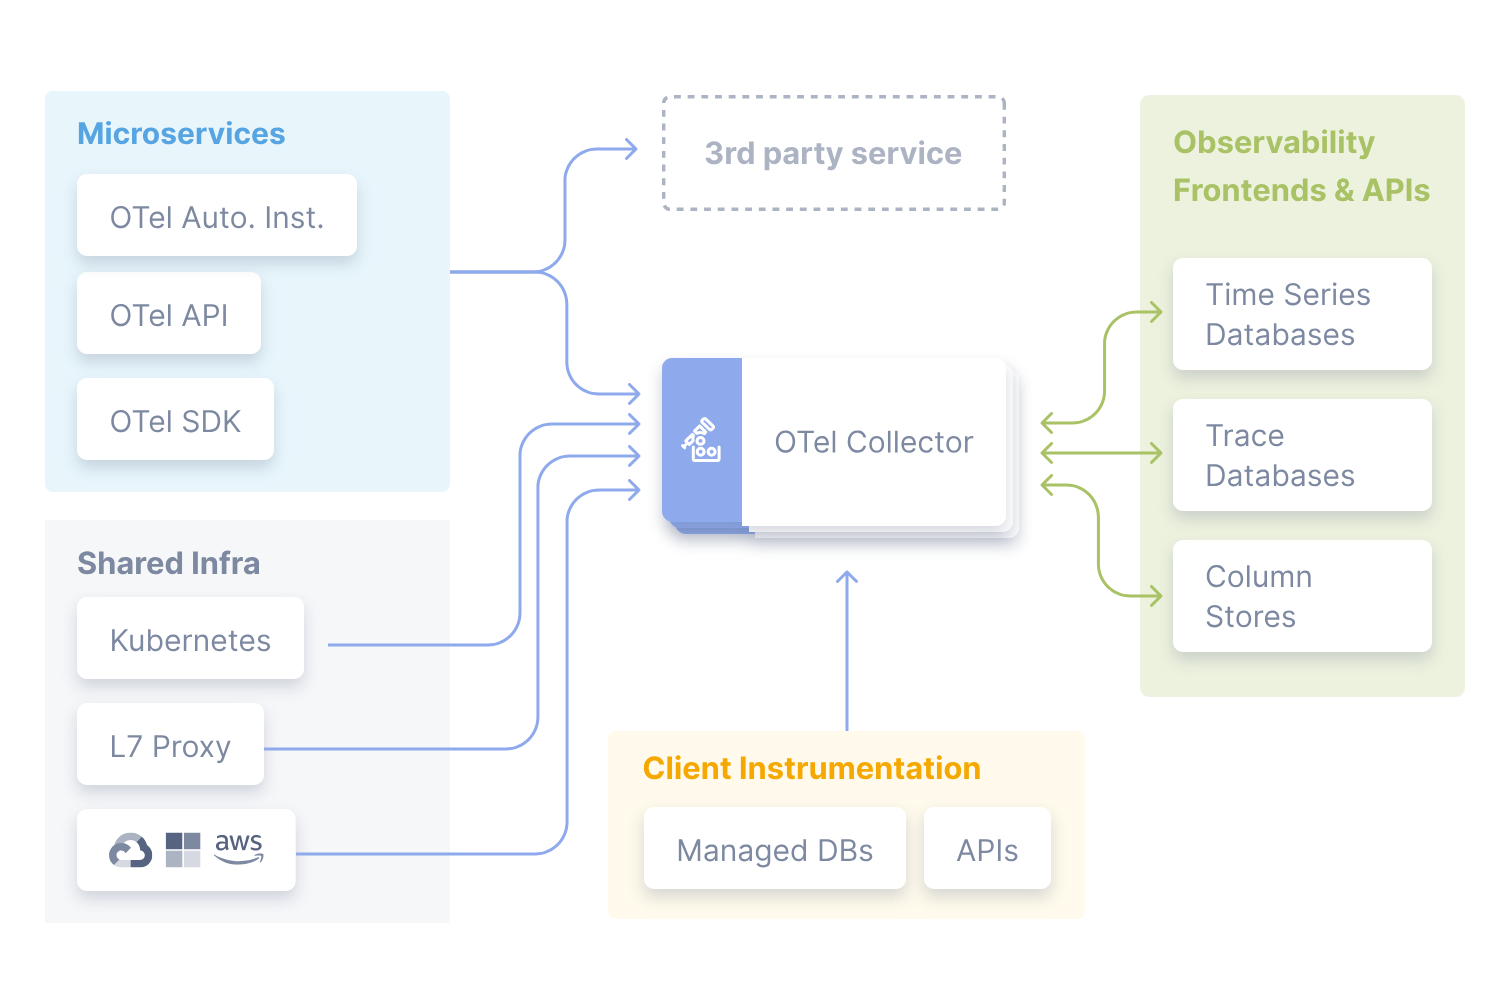
By standardizing how telemetry data is collected and shared across various services and platforms, OpenTelemetry streamlines the observability process in complex, distributed systems, making it easier to gain valuable insights. Whats even better is that because of the standardized approach in instrumentation design, this makes the OpenTelemetry instrumentation an adaptable and extensible framework meaning a more multifaceted approach to implementation.
Getting Started Instrumenting Python
Before we begin, ensure you have Python installed in your development environment and also retrieve your lumigo token from your account. If you haven’t yet signed up for Lumigo, now is the time, and it’s super quick and easy.
Start by creating a new Python virtual environment to keep our dependencies organized:
python -m venv venv

source venv/bin/activate
Once activated, install the necessary OpenTelemetry packages for Python using pip:
pip install opentelemetry-api opentelemetry-sdk opentelemetry-exporter-otlp-proto-http
For this example, we are going to use a basic python application with the standard OpentTelemetry Python libraries in conjunction with the lumigo OLTP endpoint and authorization header token. This approach can be used for a variety of telemetry data which can be included within the codebase.
To see it in action, first, create a file named app.py and add the following code:
import os

from opentelemetry import trace

from opentelemetry.sdk.trace import TracerProvider

from opentelemetry.sdk.trace.export import BatchSpanProcessor

from opentelemetry.exporter.otlp.proto.http.trace_exporter import OTLPSpanExporter

from opentelemetry.sdk.resources import SERVICE_NAME, Resource


# Replace '<Your_Token_Here>' with your actual Lumigo authorization token

lumigo_token = "<Your_Token_Here>”


# Ensure the environment variable for OTLP endpoint is set

os.environ["OTEL_EXPORTER_OTLP_ENDPOINT"] = "https://ga-otlp.lumigo-tracer-edge.golumigo.com"


# Create a tracer provider with a custom service name for your application

tracer_provider = TracerProvider(resource=Resource.create({SERVICE_NAME: "your-service-name"}))


# Set the global tracer provider

trace.set_tracer_provider(tracer_provider)


# Configure the OTLP exporter with Lumigo's endpoint and the authorization token

otlp_exporter = OTLPSpanExporter(headers={"Authorization": f"LumigoToken {lumigo_token}"})


# Add a BatchSpanProcessor to the TracerProvider using the OTLP exporter

tracer_provider.add_span_processor(BatchSpanProcessor(otlp_exporter))


# Retrieve the tracer

tracer = trace.get_tracer(__name__)


# Application logic that generates a span

with tracer.start_as_current_span("example-span"):

    # Your application logic goes here

    print("This is a simple span example being exported to Lumigo")


# Ensure to shut down properly to flush and export all remaining spans

trace.get_tracer_provider().shutdown()
Replace the placeholder values such as <Your_Token_Here> and “your-service-name” with your actual Lumigo token and a meaningful service name for your application. This example sends a simple span to Lumigo, but you can integrate this setup into a more complex application to trace different operations and requests.
Of course its important to remember that this is a demo and you should never hard code token creds within the code itself, but rather store them in a secret vault or within environmental variables.
To run this Python app in the virtual env:
python app.py
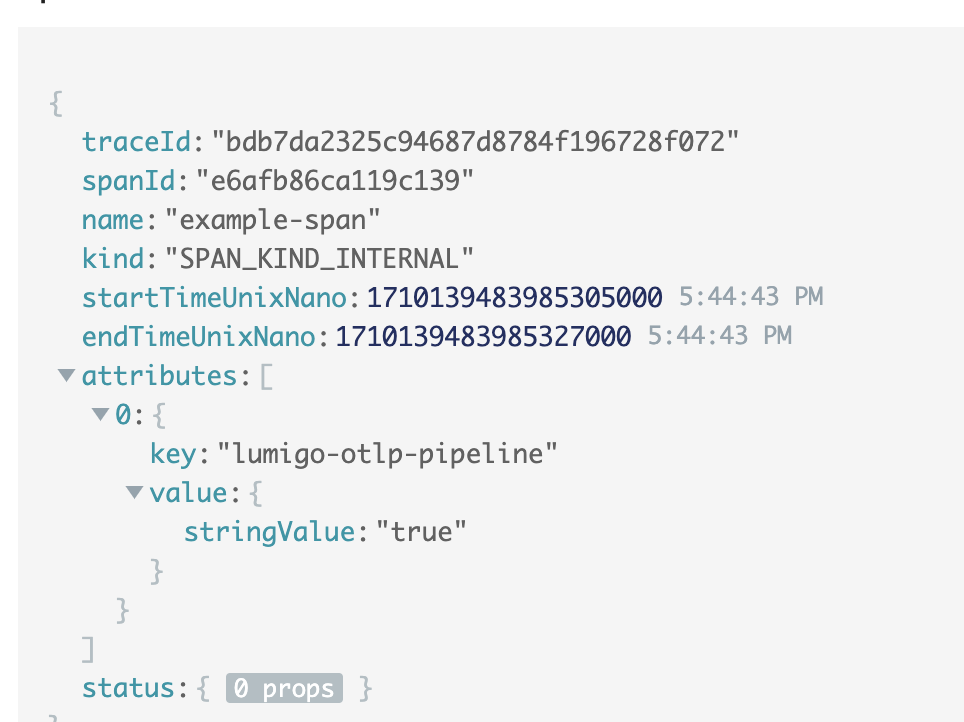
This execution will generate telemetry data, including traces for the HTTP request made by your application. This data is then exported to Lumigo using the OpenTelemetry Collector configured with Lumigo’s endpoint.
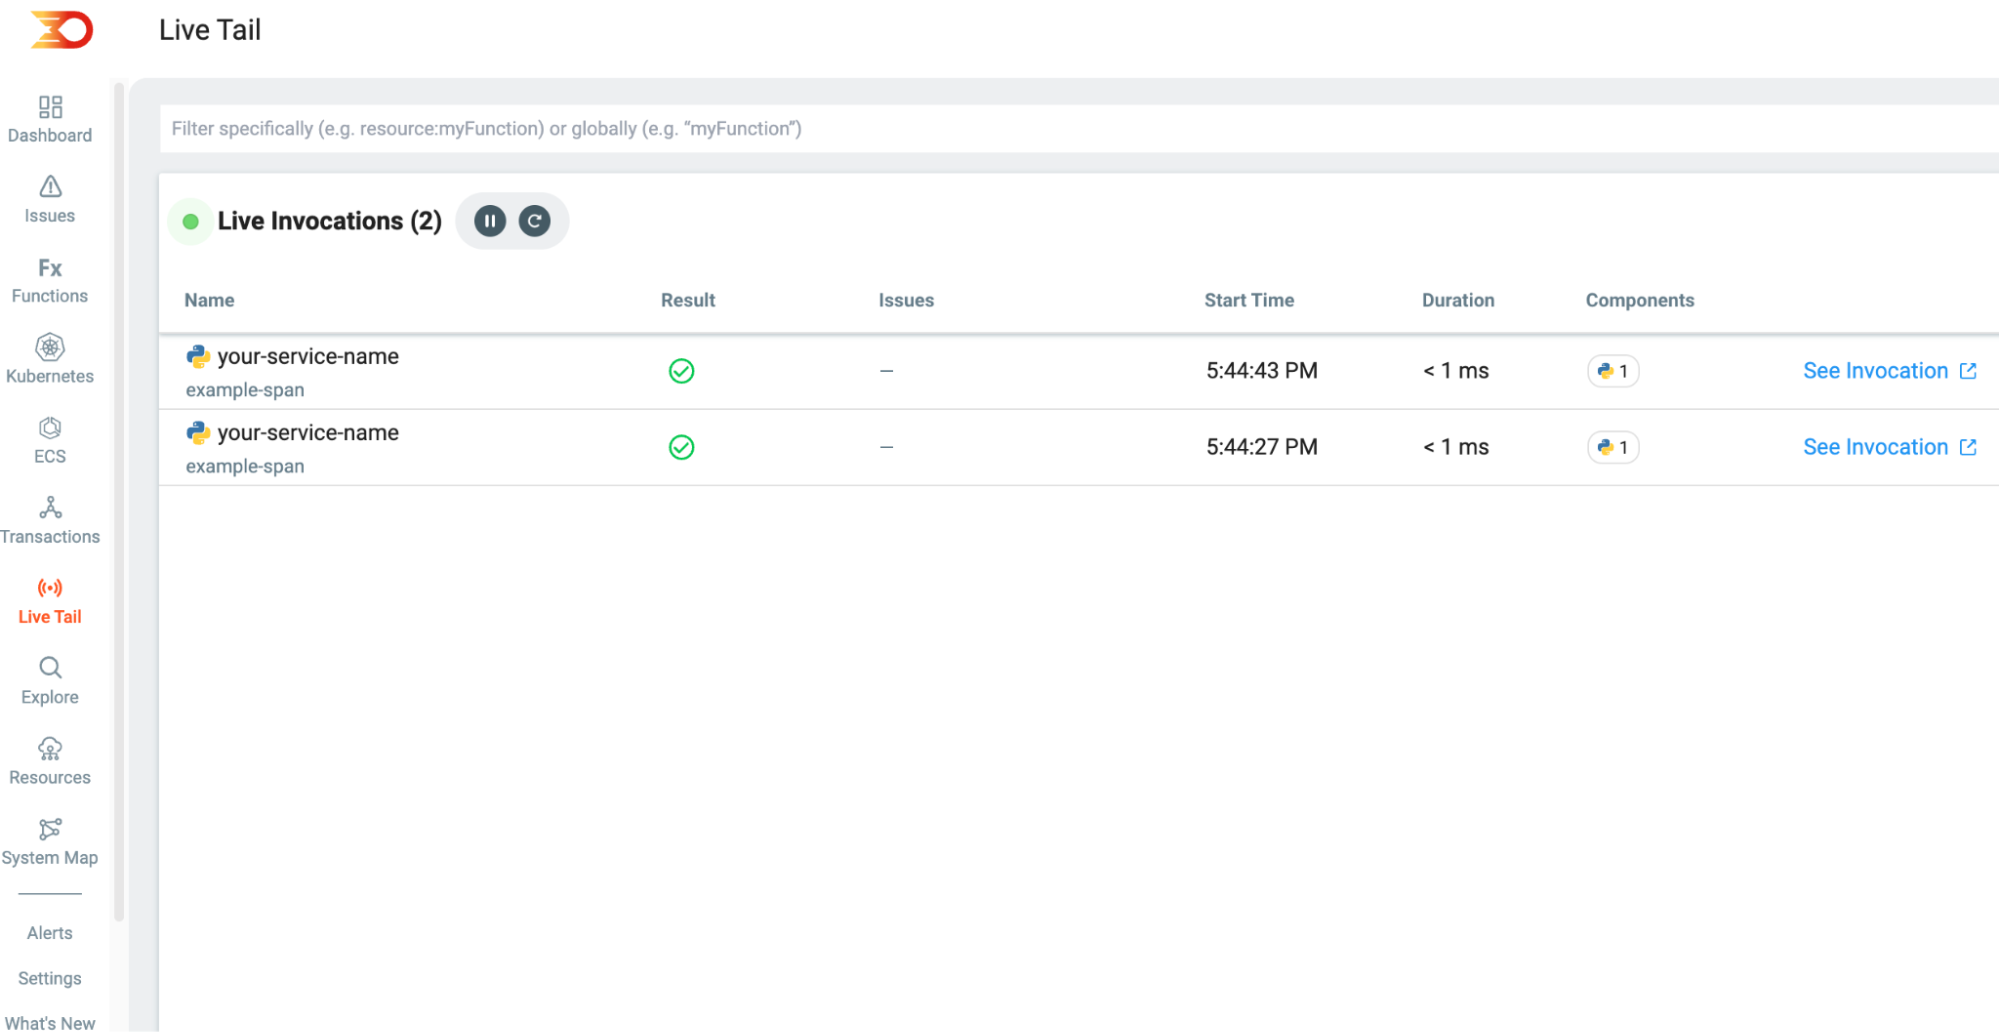
Once your application runs and generates telemetry data, you can see the trace data coming in via Lumigo account. Lumigo will provide a comprehensive view of your application’s performance, including request tracing, error tracking, and much more.
Gain visibility with OpenTelemetry
OpenTelemetry is a widely-used framework for collecting telemetry data, which is essential for achieving observability across different programming languages and platforms. Its main advantage is the standardized approach to gathering, processing and exporting telemetry data, which makes it easy to integrate with various monitoring tools and services. However, the initial setup and instrumentation can be challenging, especially in distributed and cloud-native environments.
Lumigo enhances the OpenTelemetry framework by offering auto-instrumentation capabilities for containerized applications, Kubernetes, and serverless functions, streamlining the deployment process. By signing up for Lumigo, you can seamlessly leverage the benefits of OpenTelemetry’s comprehensive observability framework, combined with the convenience and efficiency of Lumigo’s auto-instrumentation, to achieve deep insights and enhanced monitoring with minimal setup effort.