Mar 22 2021

We recently released the Lumigo Dynamic Dashboard to help our customers visualize metrics to monitor their environment the way they want.
What is it?
By letting users add “ widgets” with their own custom metrics, the Dynamic Dashboard enables them to uncover hidden insights and risks, and monitor the customized traced-based metrics they care about the most.
Example of Creating a Widget for the Dynamic Dashboard
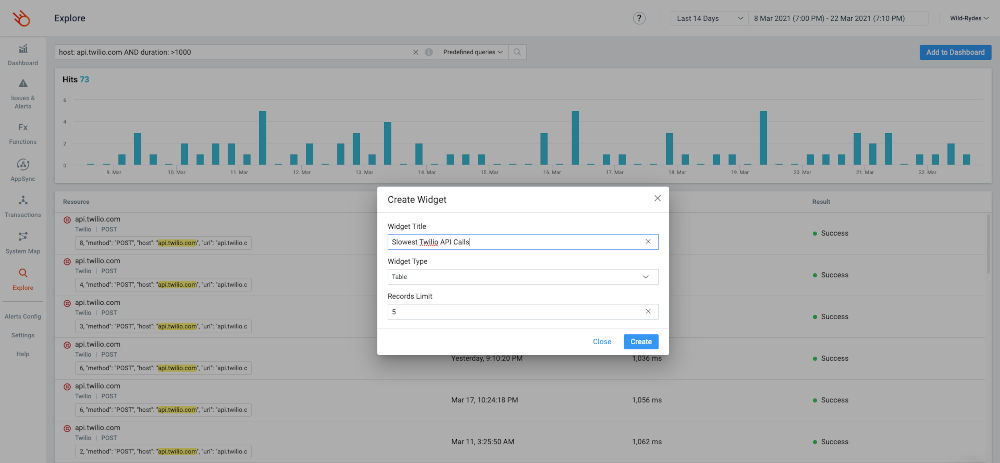
In our example, we recently came across a performance issue with the Twilio API. With Lumigo’s Explore feature, we can easily find the slowest invocations related to the Twilio API and investigate them using the Transaction View.
In the screenshot below, we’re searching for the slowest invocations related to the Twilio API:

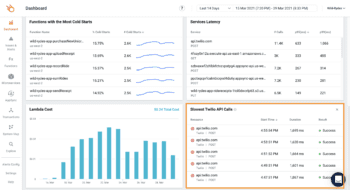
To be able to track this issue over time, we can create a customized dashboard widget for “longest-running Twilio requests” and add that widget to the dashboard., where it’s easily accessible.

How to Create Custom Dashboard Widgets
You can easily create dashboard widgets from your Explore queries to quickly track essential metrics and scenarios.
To add a custom dashboard widget, after you’ve run your query:
- Click on Add to Dashboard.
- Choose your dashboard properties.
- Click on Create – and you’re done!

What’s Next?
Try it for yourself in your Lumigo account. Go to your Lumigo dashboard.
Don’t have a Lumigo account? Sign up now. It’s free, and you’ll be up & running in minutes.

