


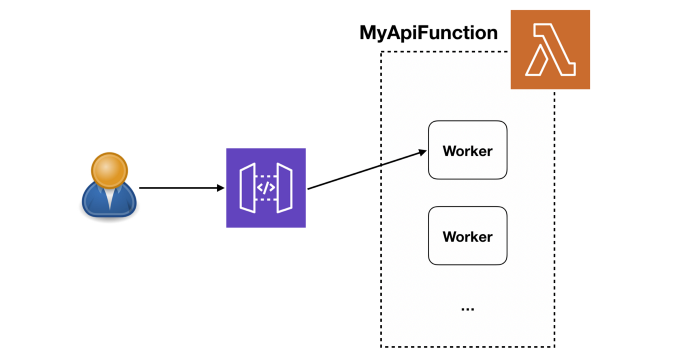
When you build your application on top of Lambda, AWS automatically scales the number of “workers” (think containers) running your code based on traffic. And by default, your functions are deployed to three Availability Zones (AZs). This gives you a lot of scalability and redundancy out of the box.
When it comes to API functions, every user request is processed by a separate worker. So the API-level concurrency is now handled by the platform. This also helps to simplify your code since you don’t have to worry about managing in-process concurrency. Consequently, gone are the days when an overloaded server means all concurrent requests on the same server will slow down.
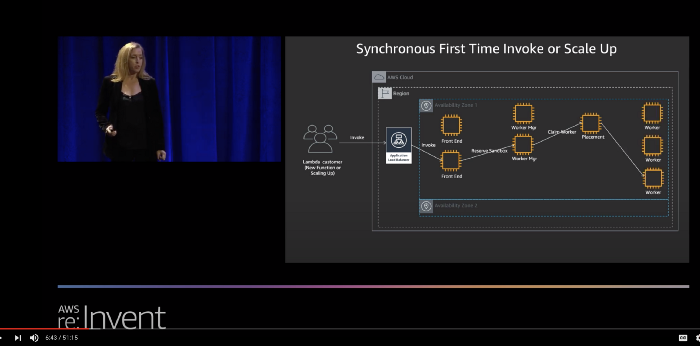
If you want to learn more about how Lambda works under the hood, I strongly recommend watching this session from Re:invent 2019.
Without the CPU contention that often affects serverful applications, the primary cause for slow Lambda response time is elevated latency from services that your functions integrate with.
In my last post, we discussed different ways you can track the latency to these external services. In this post, let’s dive a bit deeper into how to make the most of these telemetry data to debug Lambda response time issues quickly. If you don’t know how to track the latency of these external services then please check out my last post first.
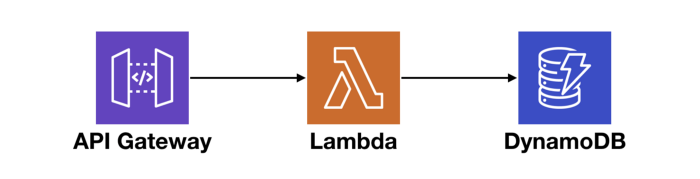
Now, suppose you have an API that consists of API Gateway, Lambda, and DynamoDB, like the following.
At the macro level, we want to know if there are systemic issues affecting our end-to-end response time. And if so, where is it? Also, if a service we depend on cannot perform at an adequate level, we need to be able to identify them and potentially replace them with alternatives.
So, let’s consider everything that can contribute towards the end-to-end request latency of this simple API.
API Gateway
API Gateway typically has a single-digit ms of latency overhead. It reports a number of system metrics to CloudWatch, including two performance metrics — Latency and IntegrationLatency.
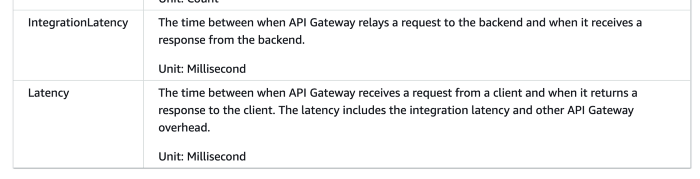
Image source: AWS
Lambda
Lambda functions report their invocation Duration to CloudWatch. During cold starts, this also includes the time it takes to initialize your function module.
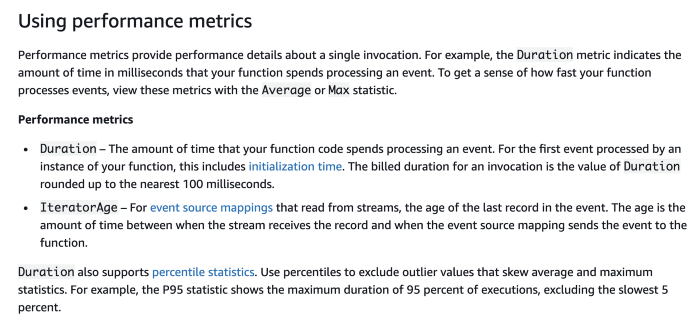
Image source: AWS
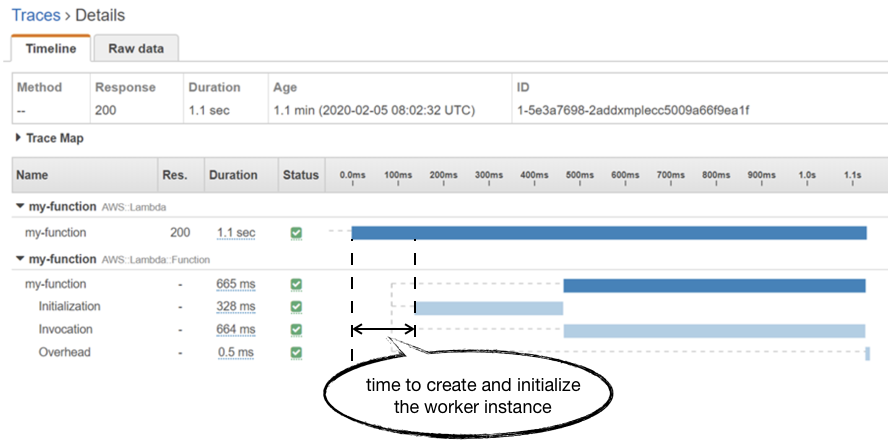
HOWEVER, this Duration metric doesn’t include the time it takes the Lambda service to create and initialize the worker instance. If you go to the 5:40 mark in the aforementioned Re:invent session, you will get a sense of what happens under the hood during a cold start.
You can see this in an AWS X-Ray trace as the unmarked time before the Initialization segment.
Unfortunately, you don’t have much control over how much time it takes the Lambda service to allocate a new worker. Although some previous analysis by a client of mine seemed to suggest that there’s an inverse relationship to the function’s memory allocation.
In practice, this allocation time seems to average around 150ms and has been steadily improving over the years for all language runtimes. Although we can’t exert any control over how long this process takes, it’s still useful to understand how it impacts our overall response time. If you’re only looking at Lambda’s Duration metric then it’s easy to miss it from your tail (p95/p99/max) latency numbers. Which is why, when it comes to API functions, I prefer to use API Gateway’s IntegrationLatency as a proxy for “total response time from Lambda”.
DynamoDB
Just like the other services, DynamoDB also reports a number of system metrics to CloudWatch. The one that’s relevant to us here is the aptly named SuccessfulRequestLatency.
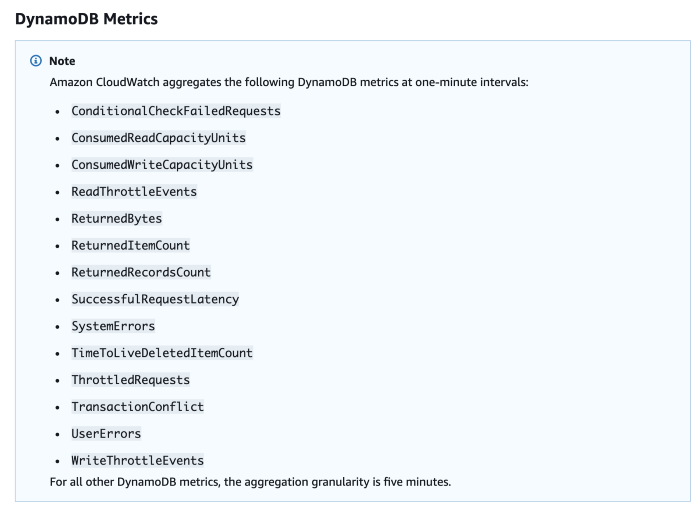
Image source: AWS
SuccessfulRequestLatency tells you how long it took DynamoDB to process a successful request. But what it doesn’t tell you is whether the caller had to perform any retries and any execution time that went into exponential delays.
The AWS SDK performs retries with exponential delay out-of-the-box, and the JavaScript SDK defaults DynamoDB retries to 10 with a starting delay of 50ms. From this, you can work out the maximum delay between each retry as the following.
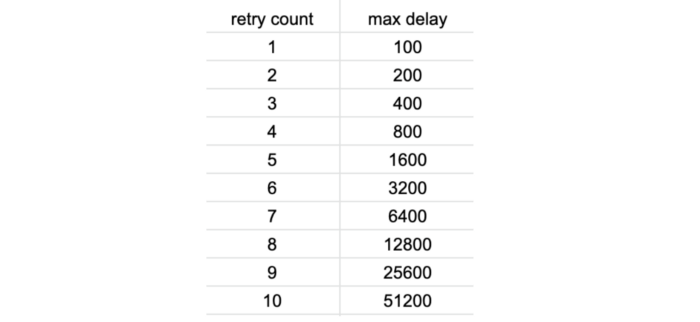
Considering that Lambda (and most frameworks such as Serverless and SAM) defaults to a low timeout value of 3–6 seconds. You only need to be slightly unlucky for a Lambda invocation to timeout after 5 or 6 DynamoDB retries. While it might not happen frequently, many have reported this as the cause for mysterious Lambda timeouts.
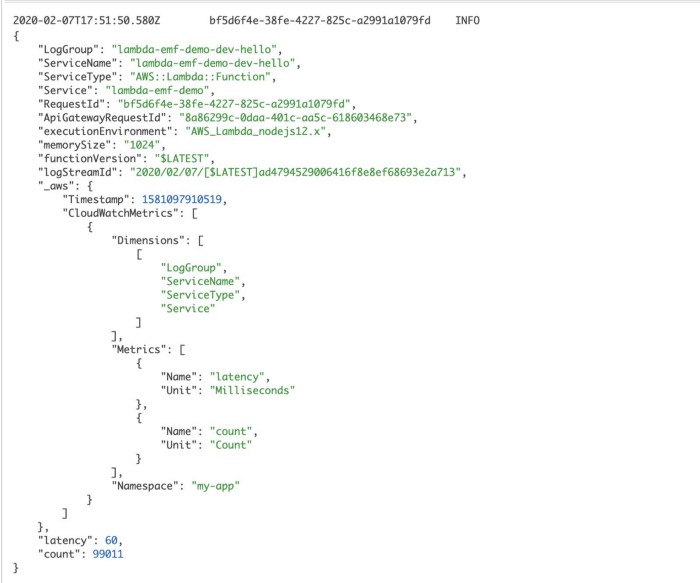
When these rare events happen, you would not see a corresponding spike in DynamoDB’s SuccessfulRequestLatency. All the more reason why you should be recording caller-side latency metrics for operations as I discussed in the last post. To record these caller-side latencies as custom metrics, consider using the Embedded Metric Format (EMF).
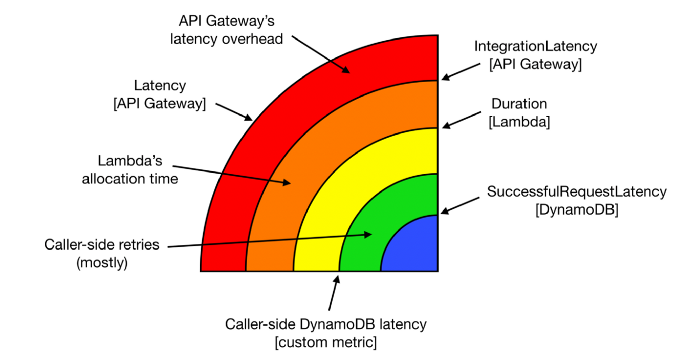
The onion layers
Armed with telemetry data about every layer of the stack that can introduce latency, we can start to see the end-to-end response time of our API as layers. Not only are the layers themselves useful information, but the gap between each layer is also a valuable data point that can help you identify the root cause for latency problems.
If you have a latency problem, it’ll be one of these guys!
These layers generally translate well to dashboards. For an API endpoint, you can lay these metrics on top of each other and they will typically follow the same general shape.
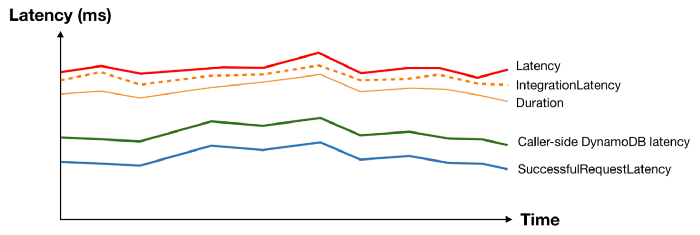
And when something interesting happens at the macro level, you can see patterns and usually spot the “odd one out”.
Take the following latency spike as an example, everything moved apart from DynamoDB’s SuccessfulRequestLatency. What could possibly cause the caller-side DynamoDB latency to spike without affecting the underlying SuccessfulRequestLatency? We don’t know for sure, but a pretty good bet would be caller-side retries and exponential delays.

Now that you have a working theory, you can gather other supporting evidence. For example, by checking to see if there’s a corresponding spike in the no. of DynamoDB throttled events.
Identifying poor-performing dependencies
As mentioned above, another question we often want to answer at the macro-level is “Are any of my dependencies performing poorly?”
To answer this question, we need to see performance metrics for our dependencies at a glance. As we already saw with DynamoDB and Lambda, most AWS services report performance metrics to CloudWatch already. However, we have to track the latency for other services that we depend on. It might be 3rd-party services such as Zuora or Stripe, or it could be internal APIs that are part of our microservices architecture.
We could track the latency of these services ourselves as custom metrics. It’s however not a scalable solution as it will be laborious and easy to miss.
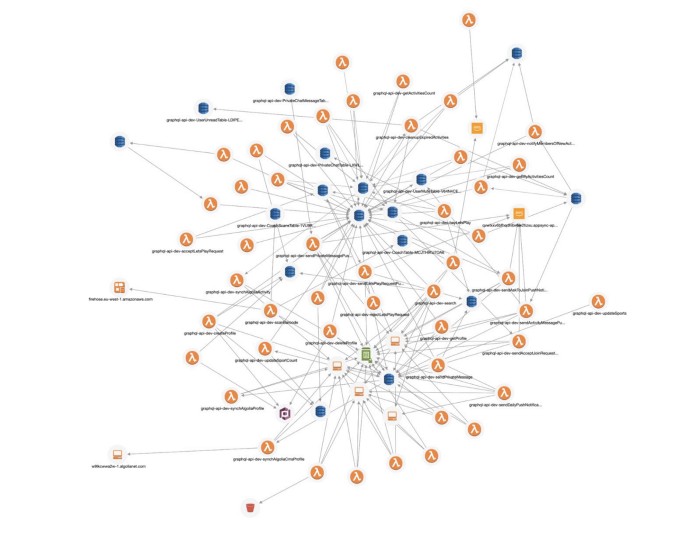
When you look at a Service Map in X-Ray, you do see a high-level performance summary of each component.
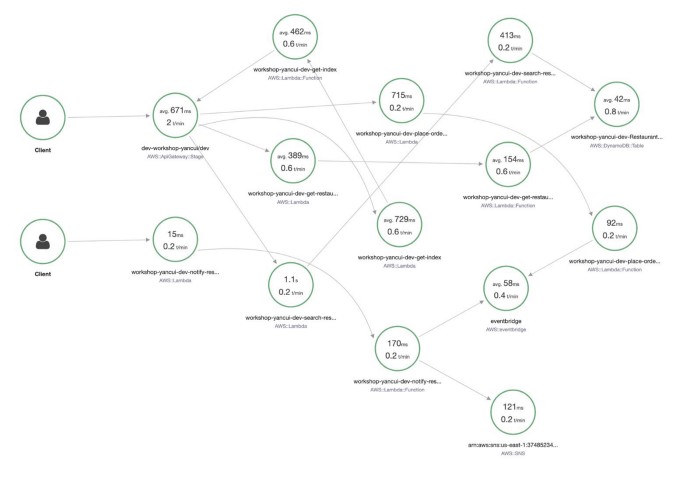
However, as you can see, the information is not organized in such a way that I can easily make sense of. Also, the data is limited to the traces that have been sampled in the selected time range. And whereas CloudWatch Metrics keep the most coarse data (1-hour aggregates) for 15 months, X-Ray keeps traces for only 30 days.
What’s more, the summary shows only average latency, which is not a meaningful measure of how well a service is performing. When measuring latency, always use tail percentile values such as p95 or p99. They tell you the upper bound response time for 95% or 99% of all requests respectively. How many requests had an average latency? Well, in the same way that all the plots below have the same average, there’s no way of knowing how good or bad the latency distribution was by looking at the average latency.
Another problem with X-Ray is that it doesn’t support many async event sources, such as DynamoDB and Kinesis streams, or S3 notifications.
And X-Ray does not support any TCP-based transactions. So if you’re using RDS or Elasticache then X-Ray would not be able to trace those transactions out-of-the-box. You will have to set up custom X-Ray segments in your code to trace the latency of TCP-based transactions.
Generally speaking, I think X-Ray is great when you’re starting out with Lambda. As with most AWS services, it’s great at meeting basic customer needs cheaply. But I often find myself growing beyond X-Ray as my architecture grows and I need more sophisticated tools for more complex serverless applications.
This is where 3rd-party observability tools can add a lot of value, as they tend to provide a more polished developer experience.
Lumigo, for instance, supports SNS, S3, Kinesis, and DynamoDB Streams and can connect Lambda invocations through these async event sources. This allows me to see an entire transaction in my application, including those background tasks that are triggered via DynamoDB Streams. You can sign up for a free Lumigo account here.
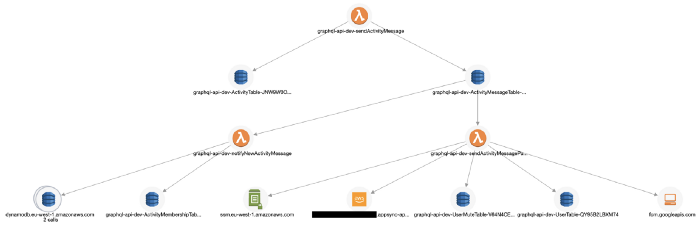
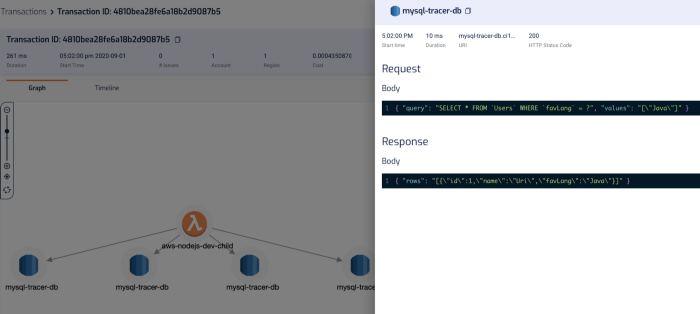
It also traces TCP-based transactions, which means I can see requests to RDS and Elasticache in my transactions.
It captures the invocation event for the function, and you can see the request and response to other services including RDS, which makes debugging functions in the wild much easier.
“mm.. why did this code throw a null reference exception?”
“ahh, because the SQL query didn’t return anything for PatientId! Why is that?!”
“aha, it’s because the user request didn’t pass in a HospitalId, and we are missing some validation logic there, so the code blew up later on when we try to process the SQL response.”
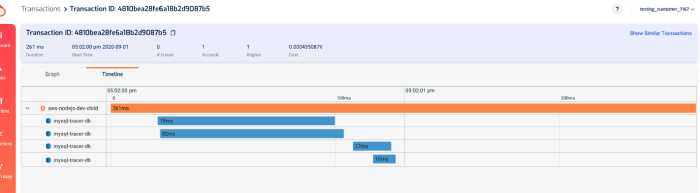
In the transaction timeline, I can also see how long those SQL queries took without having to manually instrument my code.
And, in the Lumigo Dashboard, there’s a Services Latency widget in the dashboard, which lists the tail latency for the services that your Lambda functions integrate with.
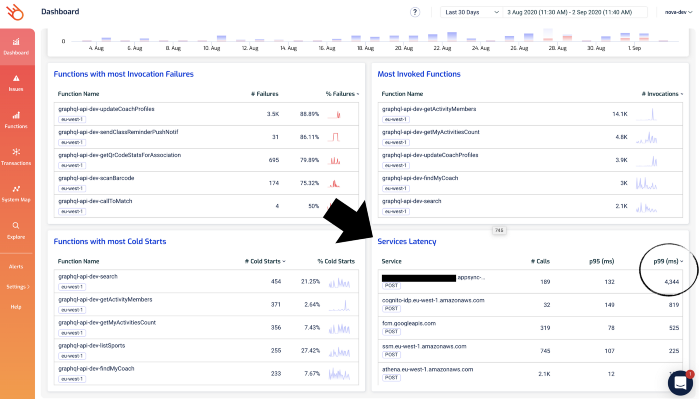
Notice that one of the AppSync endpoints has a high p99 latency. Given that the p95 latency for 189 requests is a respectable 132 ms, this is likely an outlier as opposed to a systemic problem.
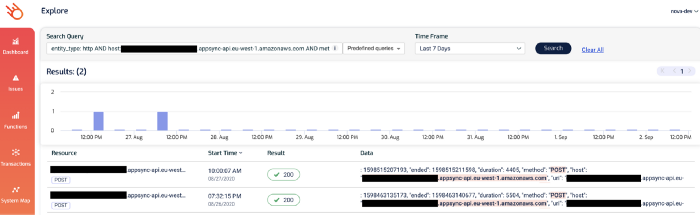
But nonetheless, it’s something that we want to check out. If you click on the 4344 figure, you’ll be taken to the Explore page and show just the relevant transactions. Both of these two transactions involved the aforementioned AppSync endpoint.
And this brings us nicely to the micro-level question of “Why was this particular request slow?”.
Tracing transactions
The techniques we discussed in the last post can really help you figure out why a particular transaction/request was slow.
For example, by logging latencies manually.
const start = Date.now()
console.log('starting doSomething')
await doSomething()
const end = Date.now()
const latency = end - start
console.log(`doSomething took ${latency}ms`)
Or by using EMF.
In both cases, we’re leaving some clues in the logs to helps us understand where the time is spent on a particular request.
Both are valuable but are not scalable solutions as you need to manually instrument every single request you make. It’s laborious and hard to enforce, and that means people will forget or cut corners, and the whole thing falls apart.
Which is why you should be using tools like X-Ray or Lumigo, which can automate a lot of these for you.
With X-Ray, you still need to write a few lines of code to instrument the AWS SDK and the HTTP module (for Javascript).
const XRay = require('aws-xray-sdk-core')
const AWS = AWSXRay.captureAWS(require('aws-sdk'))
AWSXRay.captureHTTPsGlobal(require('https'))
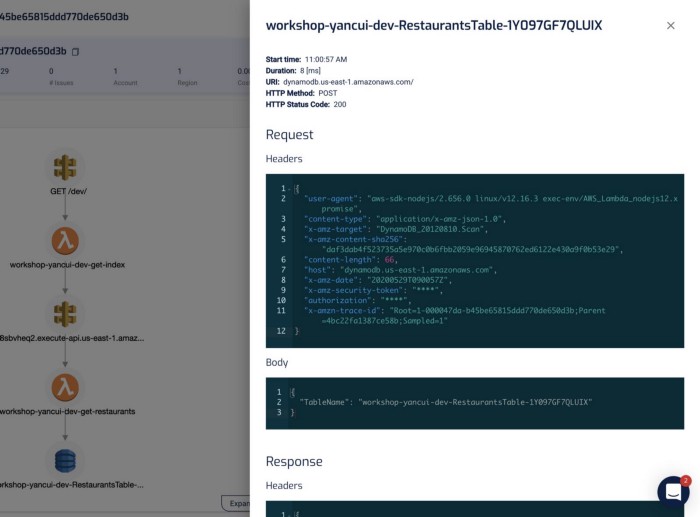
Once you’re done, X-Ray can start tracing these requests to other services for you. And you can see in the X-Ray console exactly what happened during a Lambda invocation and where did the time go.
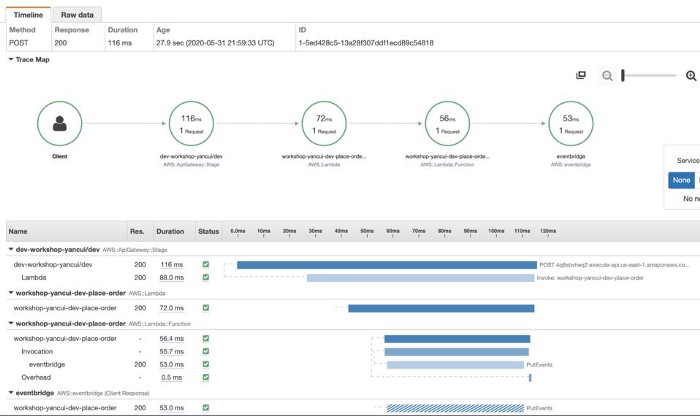
However, as mentioned earlier, X-Ray has poor support for async event sources for Lambda, and do not support TCP-based requests at all.
Also, it only collects metadata about the requests, and not the request and response themselves, which are very useful for debugging problems with the application’s business logic. And while you can log these yourself, you will have to jump between X-Ray and CloudWatch Logs consoles to see both pieces of the puzzle.
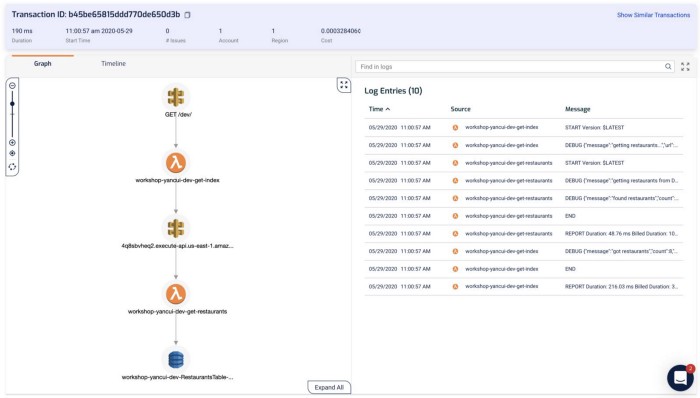
Lumigo, on the other hand, shows you the transaction and the Lambda logs (for all the functions that are part of the transaction) side-by-side. This is my favourite feature in Lumigo, as it really helps me get a complete picture of what happened during a transaction.
Clicking on each of the components in the graph shows me the request and response to and from that service, which helps me debug problems quickly. If I click on the Lambda functions, I can also see both the invocation event as well as the environment variables that were used during the invocation.
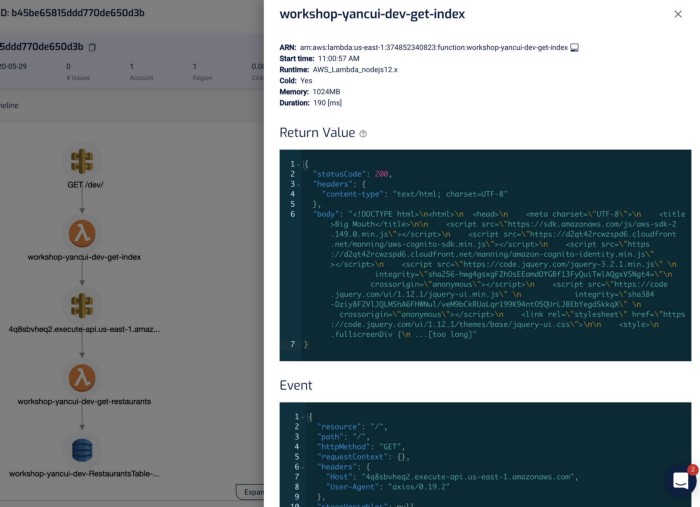
I find this a godsend for reproducing and debugging problems locally. Often, I will use this to capture invocation events for failed Lambda invocations and put them in a JSON file. From here, I can step through the code line-by-line using the Serverless framework and VS Code! See here for more details on how you can do the same yourself.
As with X-Ray, Lumigo also offers a timeline of the transaction.
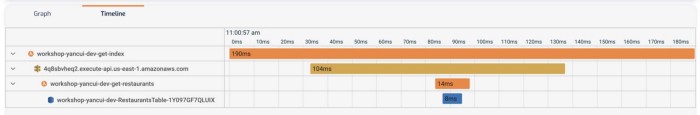
And as I mentioned earlier, all these capabilities extend to TCP-based requests too. So you can trace requests to RDS and Elasticache in the same way as you do HTTP requests.
With these capabilities, I have been able to manage and debug problems in even complex serverless applications involving many moving parts.
To learn more watch my recorded webinar
If you want to learn more about how to debug Lambda response time problems and see the mitigation strategy in action, watch the webinar I recorded on September 8th, 2020. In this webinar I demo:
- How to identify performance issues with external services
- How to debug slow Lambda response time
- Best practices for dealing with poor performing 3rd-party services
- How Lumigo can speed up debugging slow response times
The registration link is here, hope you find it helpful!