Aug 06 2024

In today’s complex cloud-native environments, observability is key to maintaining performance, reliability, and scalability. However, different teams often need to focus on different aspects of the system. Developers might be more interested in error rates and response times, while operations teams must monitor system health and resource utilization.
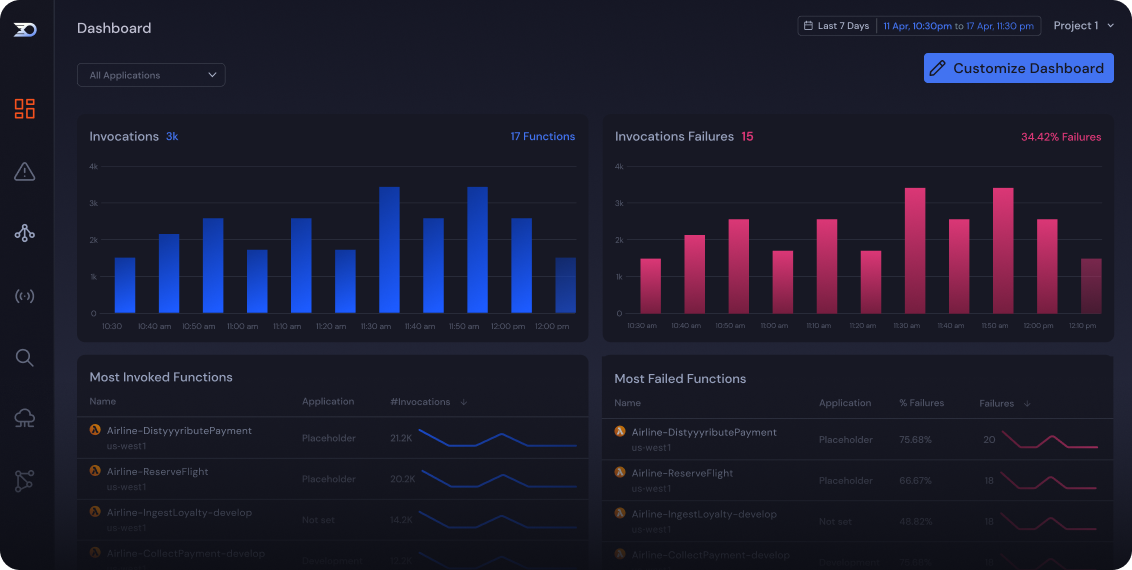
Lumigo now supports multiple dashboards, so you can provide each team with the information they need precisely how they need it. This enhancement offers a more granular view of your data, enabling you to tailor dashboards to your teams’ specific needs or various areas of your environment.
Key Benefits of Using Multiple Dashboards in Lumigo
Granular Data Views: Create tailored dashboards customized for specific teams or areas of your environment. For example, you might have one dashboard focused on cost and utilization metrics for your DevOps teams and another on application performance for your developers. This approach allows you to gain deeper insights by focusing on particular aspects of your system, ensuring that every team member has the most relevant data at their fingertips. Consequently, this improves decision-making and response times across the board.
Enhanced Collaboration: Enhance collaboration by allowing any user within a project to create, edit, or delete dashboards. This inclusive approach ensures all team members can contribute to and benefit from the dashboards. Additionally, the updated dashboard feature lets you quickly identify who created each dashboard and when, thanks to a handy tooltip near the dashboard name. This transparency fosters accountability and encourages collaboration within your team.
Improved Organization: Set a name and description for every dashboard to maintain organization and clarity. This makes it easy to understand the purpose of each dashboard, helping to avoid confusion and ensuring that everyone knows which dashboard to refer to for specific information. New projects still get the same initial dashboard, which can be edited, providing a consistent starting point while allowing flexibility for customization.
Advanced Customization: Create custom widgets for traces and logs directly from the dashboard page. This feature lets you visualize key metrics from your traces and logs, providing a comprehensive view of your system’s performance. By integrating these key metrics and visualizations into your dashboards, you can achieve a unified observability experience that covers all aspects of your system. This advanced level of customization ensures that your dashboards are not only informative but also tailored to your specific observability needs.
How to Make the Most of Multiple Dashboards
To maximize the benefits of using multiple dashboards in Lumigo, identify the key metrics most important for each team or specific area of your environment. These metrics could include error rates, duration, cold starts, memory used, and more, depending on the needs and focus of each team. Once these metrics are identified, customize your dashboards with relevant widgets and data sources. Lumigo’s flexibility allows you to name and describe each dashboard clearly, ensuring easy identification and organization.
Encourage team members to actively create and share dashboards. This collaborative approach not only enhances the collective understanding of system performance but also fosters a sense of ownership and accountability. Track who created each dashboard and when promoting transparency and collaboration. Additionally, use Lumigo’s custom widgets for traces and logs. These widgets allow you to visualize and correlate key data points effectively, making it easier to spot trends and troubleshoot issues, thereby enhancing your team’s overall efficiency and responsiveness.
Enhance Your Observability Capabilities Today
The ability to create and manage multiple dashboards within a single Lumigo project is a powerful feature that enhances your observability capabilities. By providing tailored views for different teams and areas, you can ensure everyone has the data they need to keep your systems running smoothly. Start exploring this new feature today and unlock the full potential of your observability with Lumigo. Don’t have a Lumigo account? No problem. You can sign up for a free account to explore the full power of Lumigo’s observability and troubleshooting platform.

