Serverless observability
Monitor and troubleshoot your serverless applications with AI-powered observability custom-built for serverless architectures.

Smarter observability for serverless environments
Lumigo gives you full visibility into your serverless stack—traces, logs, metrics, and payloads—all in one AI-driven platform built for speed, scale, and simplicity.
Function performance & resource usage
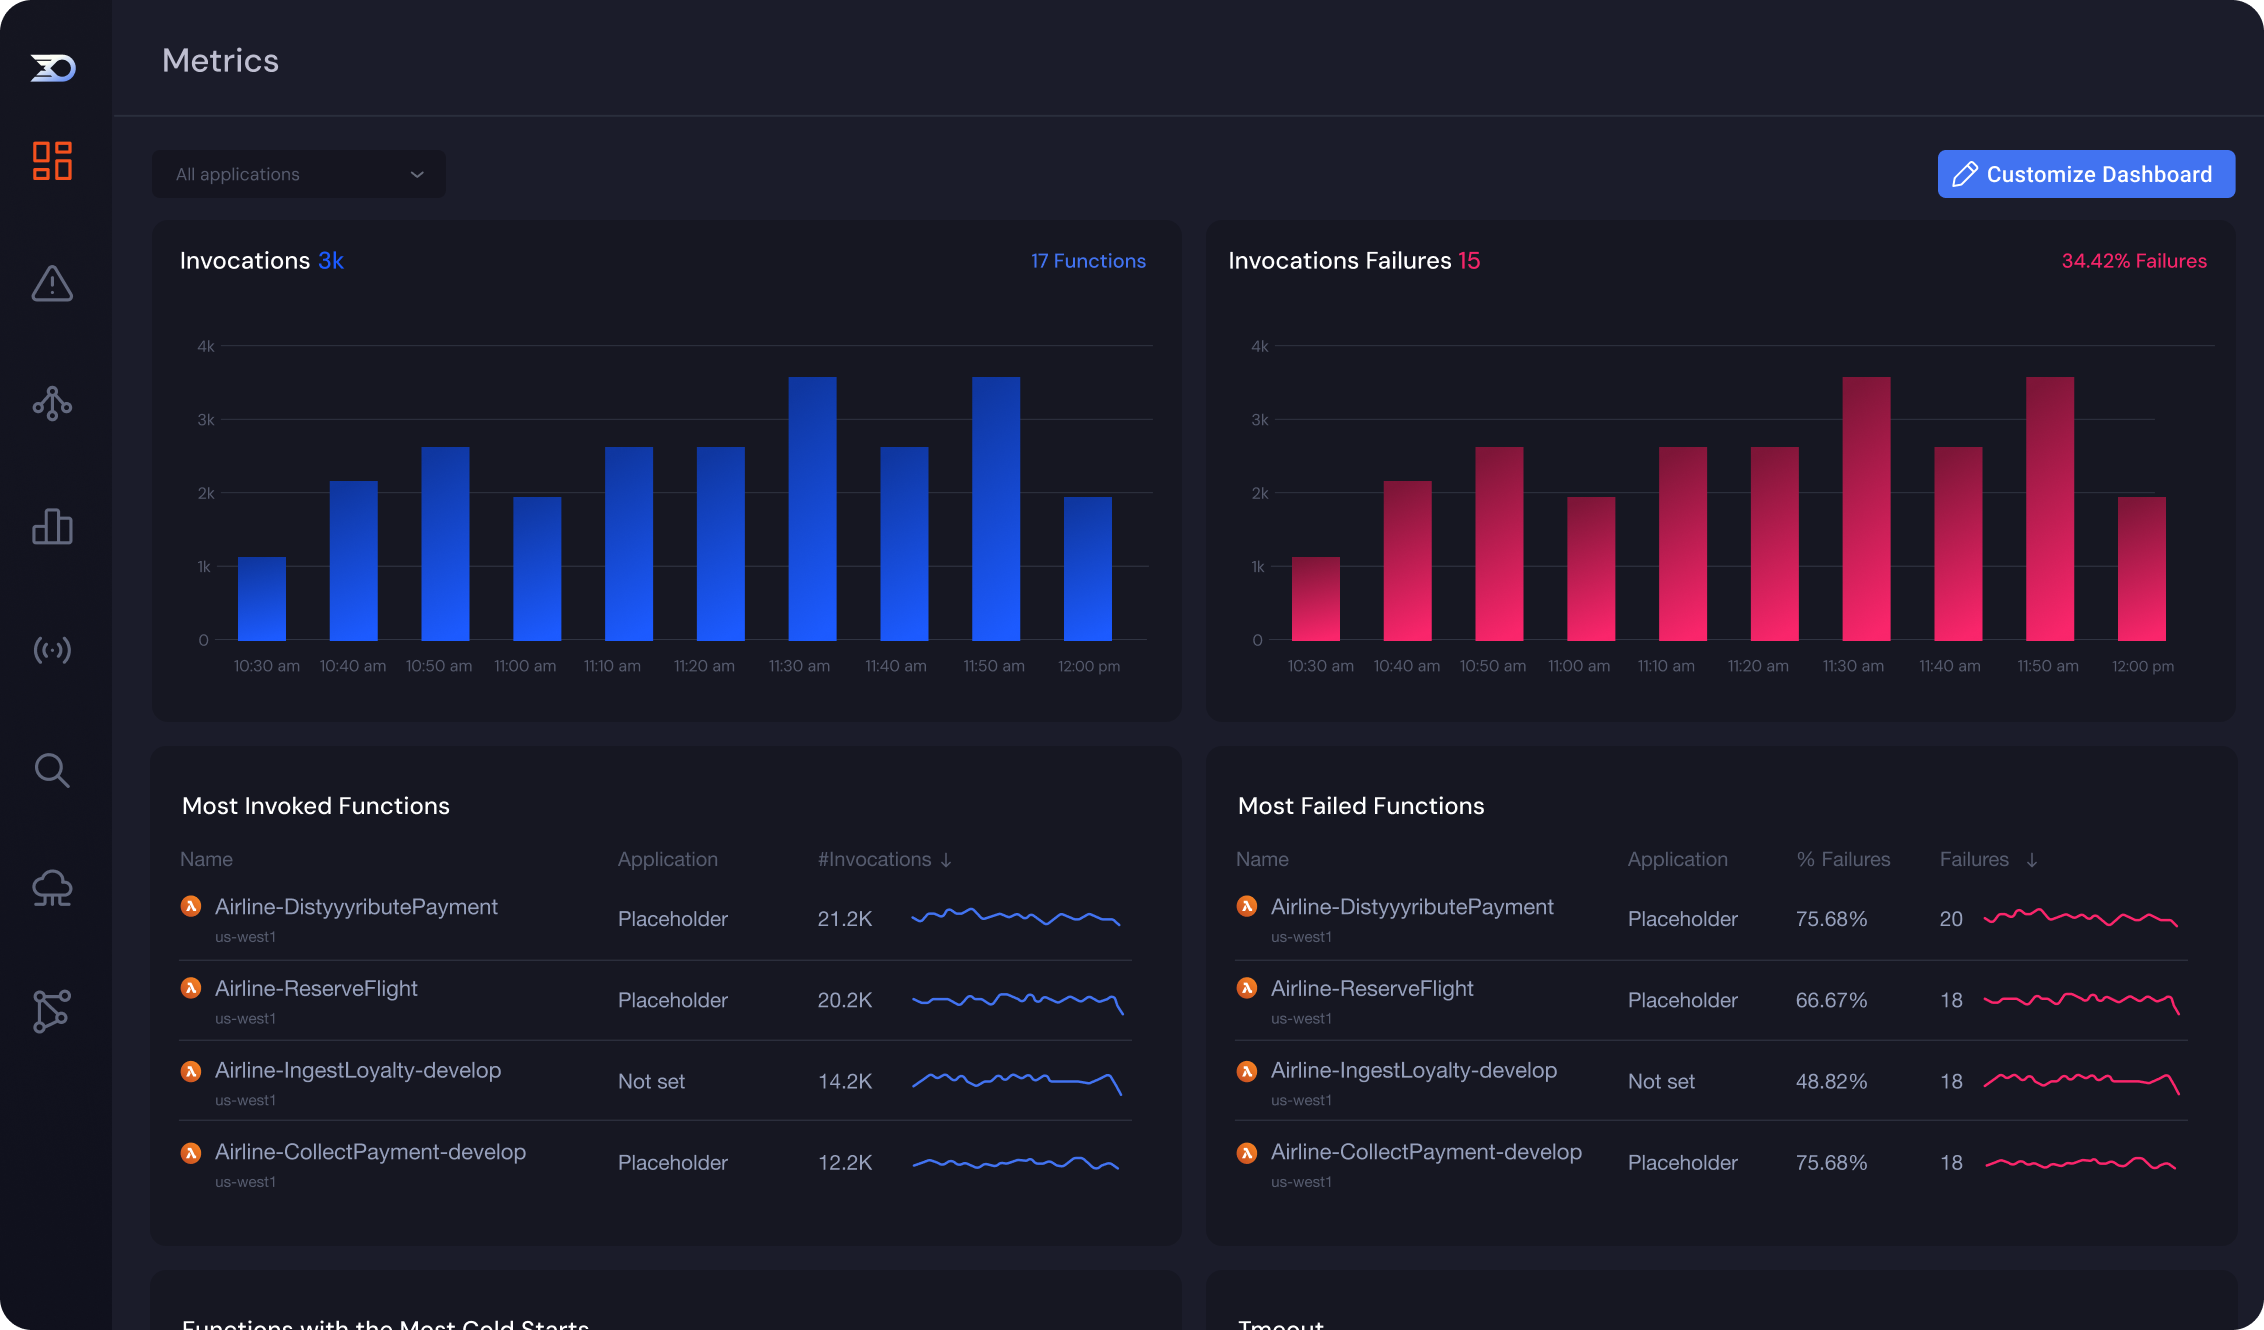
Monitor duration, memory usage, and cold starts across all functions in real time to identify slowdowns and optimize performance at scale.
Error detection & alerts
Automatically detect timeouts, exceptions, and failed invocations with real-time alerts and detailed trace-level diagnostics
Event flow & async visibility
Visualize and trace every event—from API calls to async services like SQS, SNS, and Step Functions—to troubleshoot across the entire workflow.
End-to-end correlation
Correlate traces, logs, payloads, and metrics in a single view to uncover the root cause faster and resolve issues without guesswork.
“What’s remarkable isn’t just the time saved, but the clarity of the responses. Lumigo doesn’t just tell us what’s wrong—it tells us exactly what to do about it, in language that any team member can understand and act on immediately.”
Unlock full visibility for your serverless apps
End-to-end tracing
Trace every request across your serverless stack with visual distributed tracing and real-time insights.
Payload visibility
Inspect request and response payloads in full detail, including headers and body, to troubleshoot faster.
Error and timeout detection
Catch timeouts, cold starts, and exceptions automatically with trace-level detail and built-in diagnostics.
Cold start and performance metrics
Track cold starts, memory usage, and duration trends across functions to eliminate slowdowns and tuning gaps.
Global dashboard parameters
Apply dynamic filters across widgets in your dashboards to explore data with a single change in traces, logs, and metrics.
CloudWatch metrics streaming
Stream CloudWatch metrics into Lumigo to build unified dashboards and alerts alongside traces and logs.
AI-powered troubleshooting
Use Lumigo Copilot to surface the root cause and suggest fixes using trace context and plain-language tips.
Asynchronous workflow tracing
Trace SQS, SNS, Step Functions, and async flows end-to-end while preserving context across service hops.
Smart alerts and anomaly detection
Receive real-time alerts for performance anomalies, error rates, or latency spikes before users are impacted.
Team and environment visibility
Filter and explore data by service, environment, or tag to drive efficient collaboration and faster resolution.
Third-party integrations
Extend observability using OpenTelemetry, webhooks, and APIs to connect Lumigo to your existing workflows.
Auto-instrumentation for Lambda
Instrument your functions automatically across Node.js, Python, Java, Go, and .NET with no code changes.
Manual instrumentation options
Customize behavior with manual instrumentation, including secret masking, domain scrubbing, and advanced configs.
Log correlation with traces
Automatically associate logs with trace spans using supported logging libraries like Pino, Bunyan, and more.
Lambda@edge support
Enable tracing for Lambda@Edge using lightweight manual instrumentation—designed for edge function constraints.
Deploy in minutes, not hours or days
/01
Deploy the Lumigo CloudFormation template to provision permissions in your AWS account.
/02
Lumigo automatically starts collecting telemetry from your serverless services.
/03
Log in to view traces, logs, and metrics in one unified platform.
Quickstart
Start with the basics to get going right away
1. Gain access to logs and metrics in Lumigo
View logs, analyze metrics, find issues, and set up alerts
2. Troubleshoot in minutes with distributed tracing
View end-to-end request flows to quickly identify the root cause of any issue
Get notified of issues and errors
Get notified in the channel of your choice when issues and errors occur
Invite users to join Lumigo
Solve issues faster by collaborating with your teammates
Get started with Lumigo
Whether you’re an SRE, developer, or platform engineer, Lumigo gives you the insights you need—without the complexity.