Comprehensive Application Metrics and Monitoring
Monitor and visualize your application to optimize performance and resolve issues faster.

Transform Metrics into Actionable Insights
Kubernetes Metrics
Monitor Kubernetes clusters to track resource usage, app performance, and cluster health in real-time, mitigating issues early and optimizing resources efficiently.
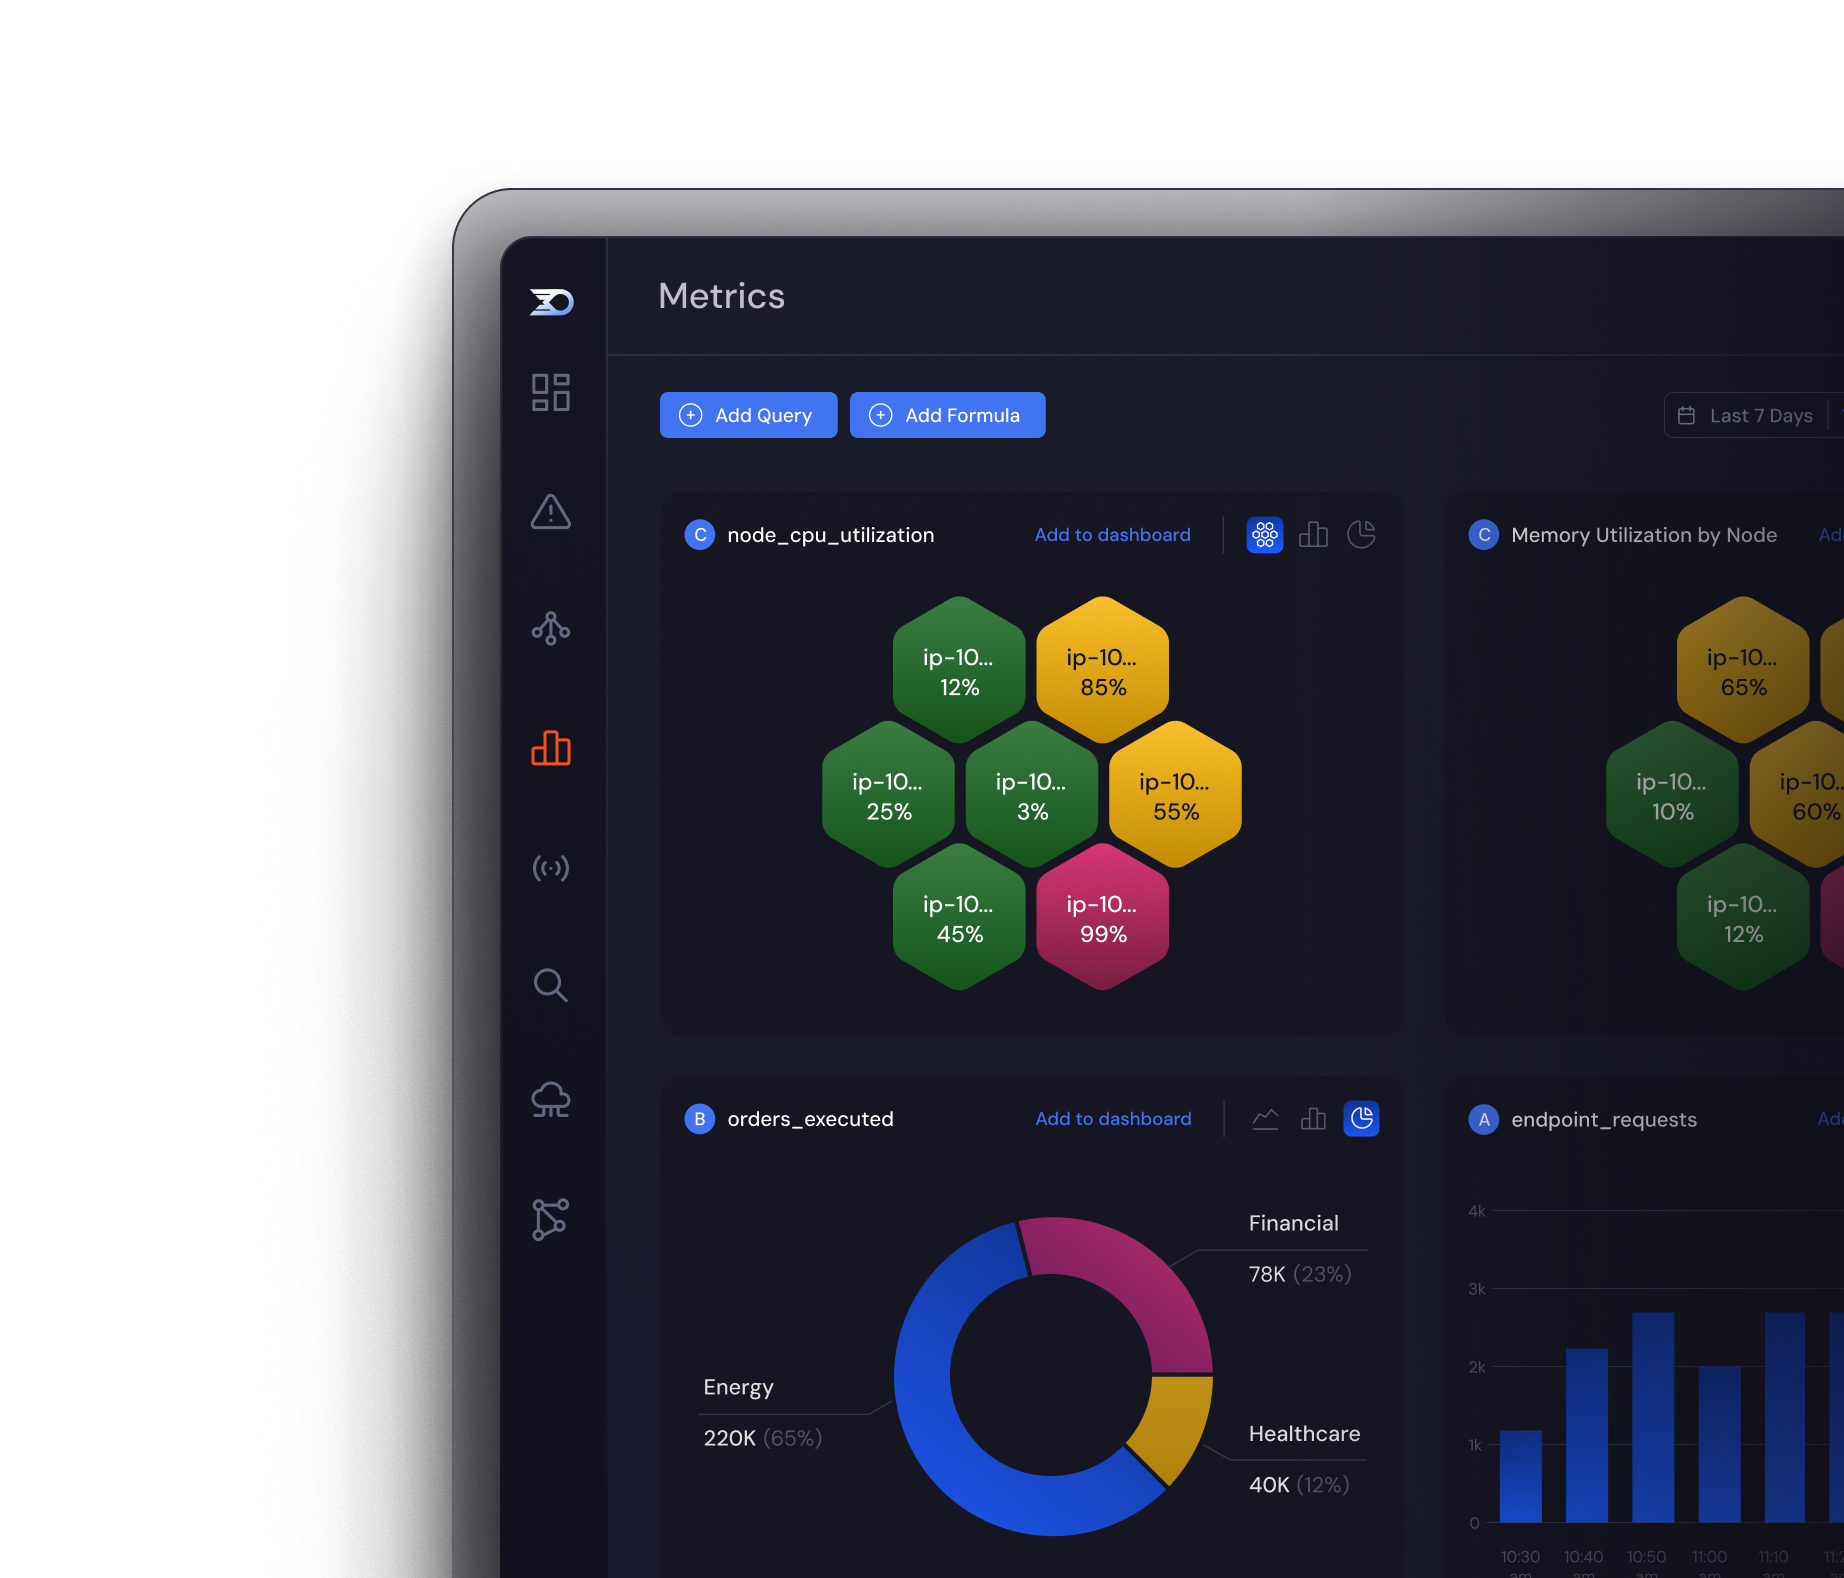
Monitor and visualize your critical metrics like CPU, memory, and storage usage across nodes, pods, and containers.
Create tailored dashboards to view key metrics and app-specific data, providing a centralized view of performance.
Custom Application Metrics
Support for OpenTelemetry and Prometheus enables you to send business-critical and performance-specific metrics for customized monitoring and alerting.
Visualize your custom metrics in unified dashboards for a complete view of application performance and health.
Track metrics like API latency, user engagement, or infrastructure health, and receive proactive alerts.
Generate Metrics From Logs and Traces
Transform logs and traces into actionable metrics for monitoring and observability, enabling you to troubleshoot and observe what matters most.
Derive key metrics like error rates, request latencies, and throughput from your logs and visualize trends.
Set alerts, identify trends, and optimize performance reducing downtime and improving user experience.
Seamless CloudWatch Integration
Send CloudWatch metrics from dozens of services to unify infrastructure monitoring. Visualize all your application data in one platform, reducing the need to toggle between two tools.
Comprehensive Metrics for Operational Excellence
Accelerates Problem Resolution
Detect, diagnose, and resolve issues before they impact production, reducing mean time to recovery (MTTR).
Boosts Operational Efficiency
By centralizing metrics and monitoring data, teams reduce tool sprawl, streamline workflows, and focus on high-impact tasks.
Strengthens Reliability and Uptime
Proactively monitor the health of your applications, helping ensure that systems are always performant and resilient.
Empowers Proactive Management
Real-time visibility into performance trends and resource usage prevents issues and bottlenecks before they occur.
“Lumigo allows us to have 100% visibility into all of our microservices, which has resulted in a remarkable 80% improvement to our MTTR.“
FAQs
What data sources, environments, and frameworks does Lumigo support?
Lumigo integrates with logs, traces, and other telemetry data from modern cloud environments. It provides detailed payload data to enhance visibility. Lumigo is compatible with a variety of programming languages and frameworks, including Node.js, Python, Java, and .NET, making it versatile for diverse development stacks.
How easy is it to deploy Lumigo and configure the solution in our environment?
Detailed documentation, guided wizards, and Lumigo’s user-friendly interface make configuring the solution in even the most complex environments a seamless process. Many users have Lumigo up and running in minutes.
How are metrics extracted from logs and traces?
Lumigo parses logs and traces automatically to extract key metrics such as latency, error rates, and throughput. Metrics are correlated with traces and payload data, offering end-to-end observability for each transaction or request.
How does Lumigo handle sensitive data, and what compliance standards (e.g., SOC 2, GDPR) are supported?
Sensitive data is protected in Lumigo through advanced data masking techniques applied before ingestion, ensuring compliance with industry standards. Lumigo adheres to SOC 2 and GDPR requirements, providing secure handling of customer data and supporting privacy regulations for businesses worldwide. These practices ensure data integrity while maintaining robust security protocols.
What kind of querying capabilities does Lumigo offer
Lumigo provides powerful querying capabilities, enabling users to search metrics and logs through a unified interface. Advanced filtering options allow for drill-downs by services, time ranges, environments, or custom tags, and users can create and save custom queries to monitor specific KPIs or troubleshoot effectively. This flexibility ensures precise and efficient data exploration tailored to user needs.
What visualizations and dashboards are available for monitoring?
Lumigo offers interactive and customizable dashboards with a variety of pre-built options for monitoring environments like serverless and Kubernetes. Visual insights include identifying bottlenecks, timeline views for request flows, and real-time anomaly detection. Users can create custom dashboards and monitor multiple environments, such as staging and production, in a unified interface, enabling effective monitoring and troubleshooting.
