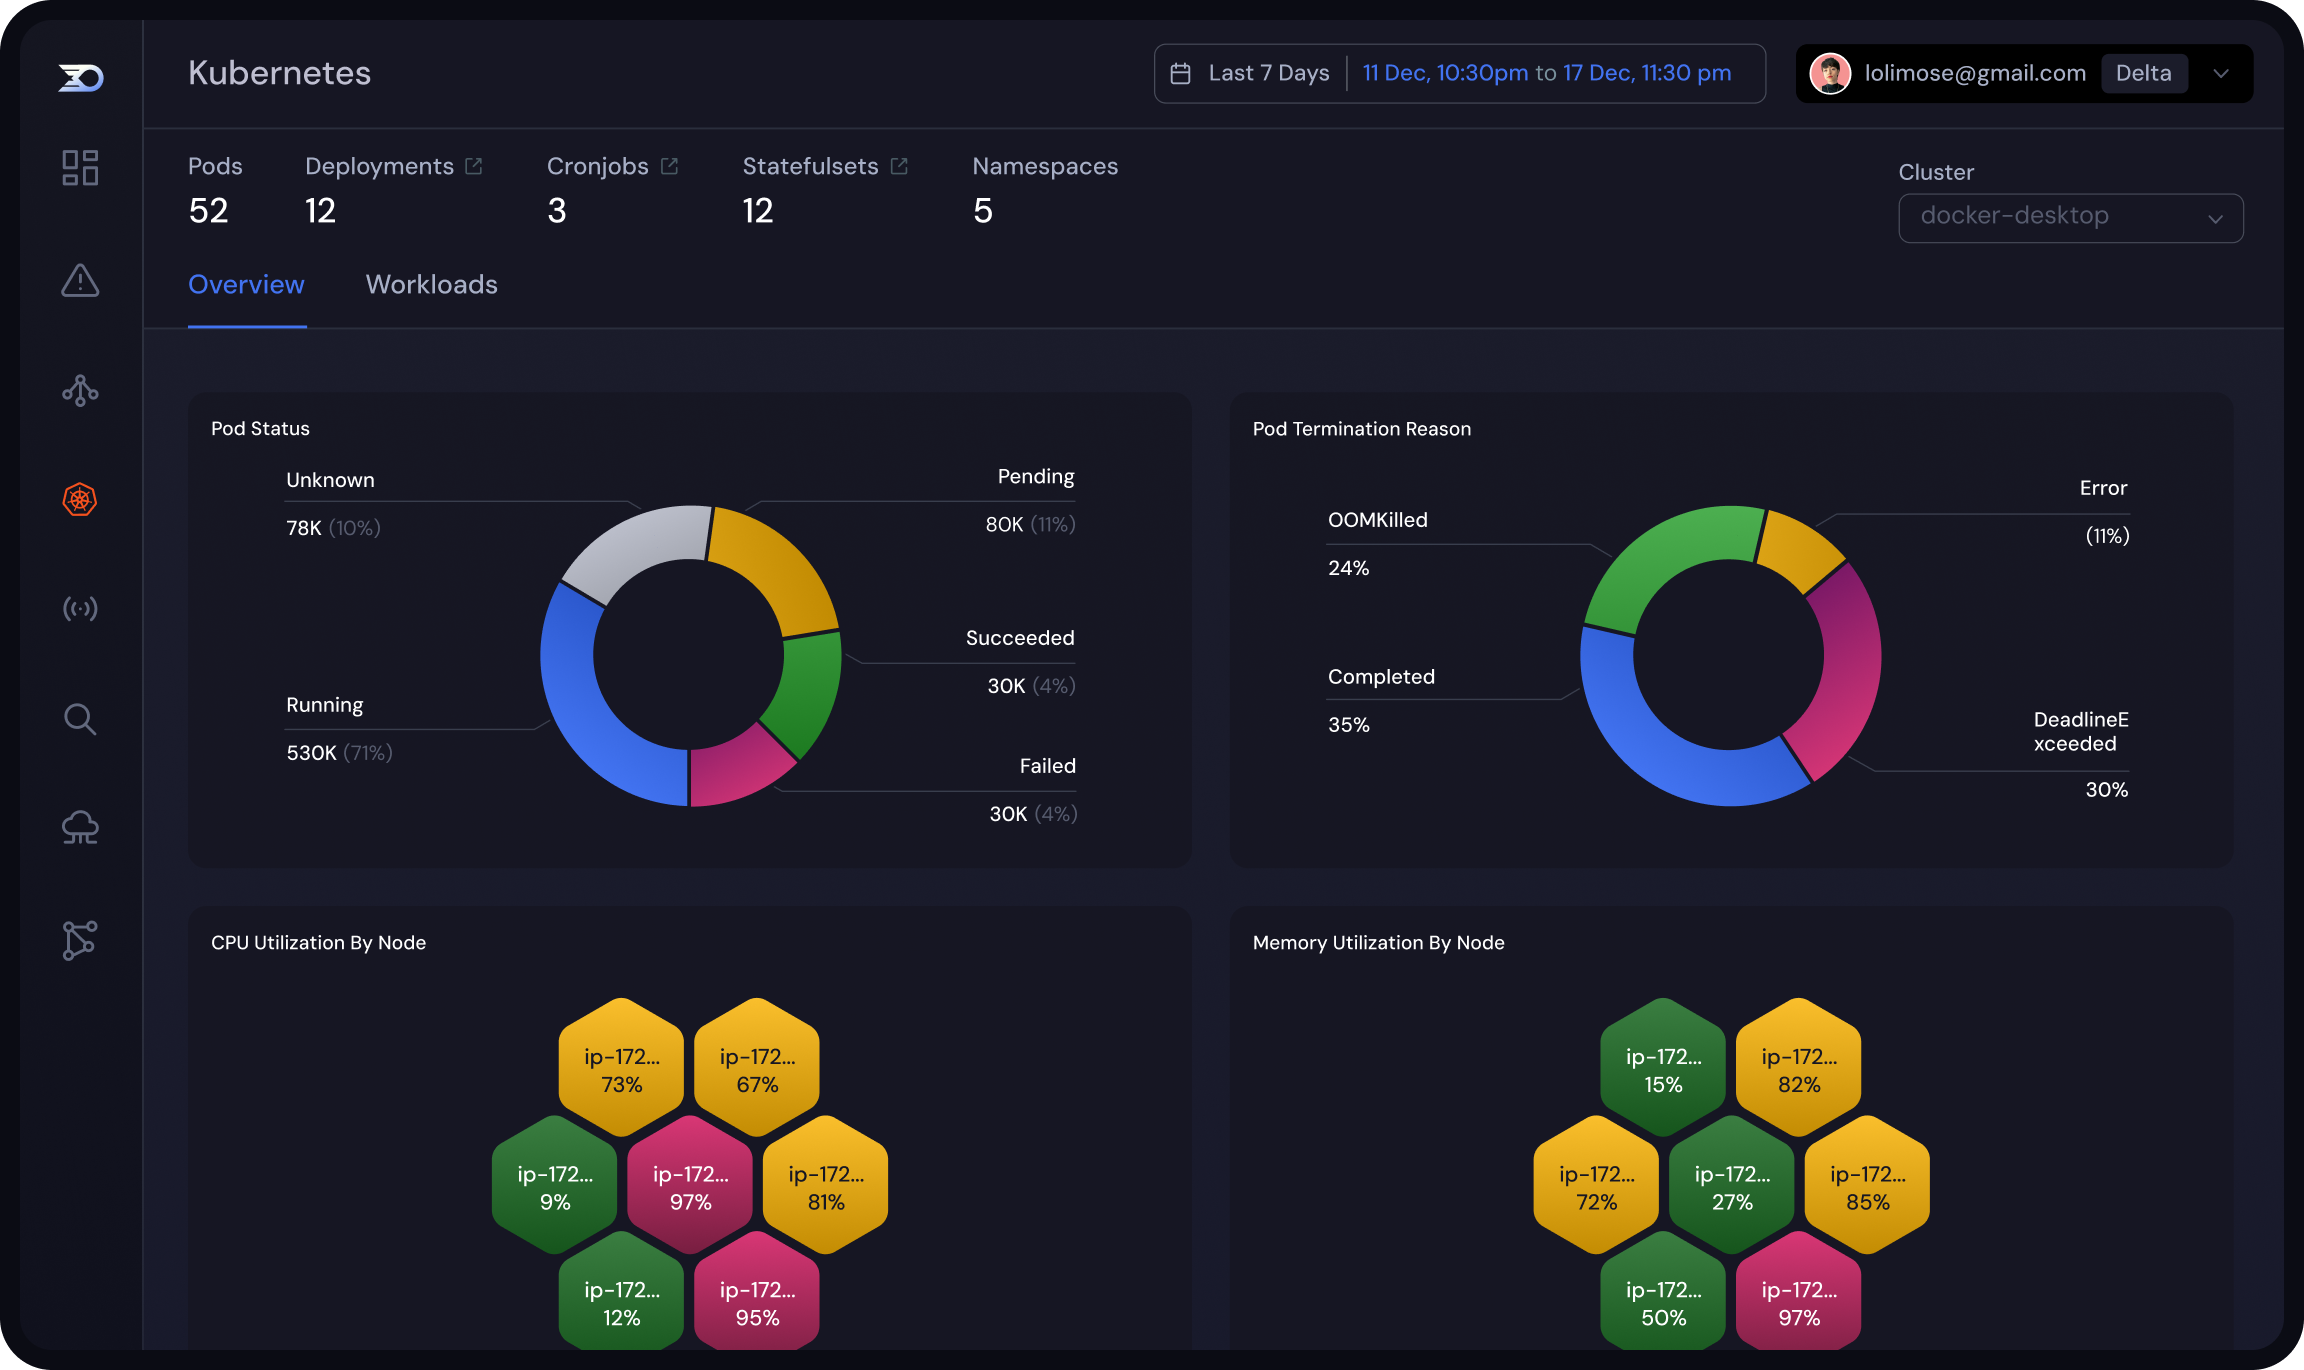
Kubernetes observability
Simplify K8 observability by automatically collecting logs, metrics, and traces—giving you the complete picture of your clusters without the heavy lifting.

Full visibility into your K8s cluster
With essential infrastructure metrics and interactive graphs, troubleshoot bottlenecks and optimize resource allocations.
CPU and memory usage
Gain real-time visibility into CPU and memory usage across your cluster to detect spikes, imbalances, and inefficiencies while ensuring optimal performance.
Pod statuses & events
Gain valuable insights into the health, status, events, and resource allocation of pods across your cluster to identify potential issues before they affect system stability.
Log monitoring & alerts
Get real-time log alerts and a dynamic dashboard to instantly detect and respond to issues in your K8s environment with full visibility into logs and automated insights.
Seamless correlation
Correlate metrics, events, traces, and logs for a complete picture of your cluster’s health and performance. Quickly pinpoint issues by connecting the dots across all observability data.
“Lumigo brings fast, frictionless observability to Kubernetes with a lightweight operator, complete traces with payloads, and smart log and metric correlation—at a lower cost of legacy tools.”
Unlock full Kubernetes visibility
Real-time visibility into K8 workloads
Get instant insights into your workloads, including pods and deployments, with real-time data at your fingertips.
Proactive health monitoring
Set up intelligent alerts for failed pods, high resource consumption, or degraded performance to fix issues before they impact users.
Faster issue resolution
Pinpoint performance bottlenecks, failed deployments, and unhealthy pods with intelligent alerts and troubleshooting recommendations.
Deep context across metrics, logs, and traces
Seamlessly correlate application logs, infrastructure metrics, and distributed traces to diagnose and resolve issues faster.
Filter events for targeted insights
Easily view events related to specific workloads or pods for targeted troubleshooting.
Container pending & termination
See the root cause of pending or terminating containers to improve scheduling, resource allocation, and stability.
Deploy in minutes, not hours or days
/01
Install the Lumigo Kubernetes Operator with a simple deployment.
/02
Automatically collect logs, metrics, and traces—no manual setup required.
/03
Visualize insights in real-time through interactive dashboards.
helm repo update && \

echo "

cluster:

     name: <cluster name>

lumigoToken:

      value: <Lumigo token>

monitoredNamespaces:

       - namespace: <namespace>

       loggingEnabled: true

       tracingEnabled: true

       - namespace: <namespace>

       loggingEnabled: false

       tracingEnabled: true

" | helm upgrade -i lumigo lumigo/lumigo-operator --namespace
lumigo-system --create-namespace --values-
Get started with Lumigo
Whether you’re an SRE, developer, or platform engineer, Lumigo gives you the insights you need—without the complexity.