


A key metric for measuring how well you handle system outages is the Mean Time To Recovery or MTTR. It’s basically the time it takes you to restore the system to working conditions. The shorter the MTTR, the faster problems are resolved and the less impact your users would experience and hopefully the more likely they will continue to use your product!
And the first step to resolve any problem is to know that you have a problem. The Mean Time to Discovery (MTTD) measures how quickly you detect problems and you need alerts for this — and lots of them.
Exactly what alerts you need depends on your application and what metrics you are collecting. Managed services such as Lambda, SNS, and SQS report important system metrics to CloudWatch out-of-the-box. So depending on the services you leverage in your architecture, there are some common alerts you should have. And here are some alerts that I always make sure to have.
Lambda (regional alerts)
You might have noticed the regional metrics (I know, the dashboard says Account-level even though its own description says it’s “in the AWS Region”) in the Lambda dashboard page.

Regional concurrency alert
The regional ConcurrentExecutions is an important metric to alert on. Set the alert threshold to ~80% of your current regional concurrency limit (which starts at 1000 for most regions).
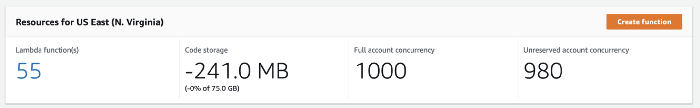
This way, you will be alerted when your Lambda usage is approaching your current limit so you can ask for a limit raise before functions are throttled.
Regional throttles alert
You may also wish to add alerts to the regional Throttles metric. But this depends on whether or not you’re using Reserved Concurrency. Reserved Concurrency limits how much concurrency a function can use and throttling excess invocations shows that it’s doing its job. But those throttling can also trigger your alert with false positives.
Lambda (per-function alerts)
(Note: depending on the function’s trigger, some of these alerts might not be applicable.)
Error rate alert
Use CloudWatch metric math to calculate the error rate of a function — i.e., 100 * Errors / MAX([Errors, Invocations]). Align the alert threshold with your Service Level Agreements (SLAs). For example, if your SLA states that 99% of requests should succeed then set the error rate alert to 1%.
Throttles alert
Unless you’re using Reserved Concurrency, you probably shouldn’t expect the function’s invocations to be throttled. So you should have an alert against the Throttles metric.
DeadLetterErrors alert
For async functions with a dead letter queue (DLQ), you should set up an alert against the DeadLetterErrors metric. This tells you when the Lambda service is not able to forward failed events to the configured DLQ.
DestinationDeliveryFailures alert
Similar to above, for functions with Lambda Destinations, you should set up an alert against the DestinationDeliveryFailures metric. This tells you when the Lambda service is not able to forward events to the configured destination.
IteratorAge alert
For functions triggered by Kinesis or DynamoDB streams, the IteratorAge metric tells you the age of the messages they receive. When this metric starts to creep up, it’s an indicator that the function is not keeping pace with the rate of new messages and is falling behind. The worst-case scenario is that you will experience data loss since data in the streams are only kept for 24 hours by default. This is why you should set up an alert against the IteratorAge metric so that you can detect and rectify the situation before it gets worse.
How Lumigo helps
Even if you know what alerts you should have, it still takes a lot of effort to set them up. This is where 3rd-party tools like Lumigo can also add a lot of value. For example, Lumigo enables a number of built-in alerts (using sensible, industry-recognized defaults) for auto-traced functions so you don’t have to manually configure them yourself. But you still have the option to disable alerts for individual functions should you choose to.
Here are a few of the alerts that Lumigo offers:
- Predictions – when Lambda functions are dangerously closed to resource limits (memory/duration/concurrency, etc.)
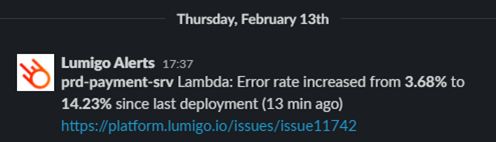
- Abnormal activity detected – invocations (increase/decrease), errors, cost, etc. See below for an example.
- On-demand report of misconfigured resources (missing DLQs, wrong DynamoDB throughput mode, etc.)
- Threshold exceeded: memory, errors, cold starts, etc.
- Lambda’s runtime crash
Furthermore, Lumigo integrates with a number of popular messaging platforms so you can be alerted prompted through your favorite channel.

Oh, and Lumigo does not charge extra for alerts. You only pay for the traces that you send to Lumigo, and it has a free tier for up to 150,000 traced invocations per month. You can sign up for a free Lumigo account here.
API Gateway
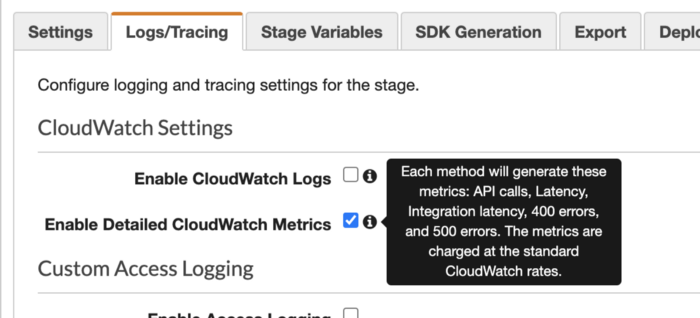
By default, API Gateway aggregates metrics for all its endpoints. For example, you will have one 5xxError metric for the entire API, so when there is a spike in 5xx errors you will have no idea which endpoint was the problem.
You need to Enable Detailed CloudWatch Metrics in the stage settings of your APIs to tell API Gateway to generate method-level metrics. This adds to your CloudWatch cost but without them, you will have a hard time debugging problems that happen in production.
Once you have per-method metrics handy, you can set up alerts for individual methods.
p90/p95/p99 Latency alert
When it comes to monitoring latency, never use Average. “Average” is just a statistical value, on its own, it’s almost meaningless. Until we plot the latency distribution we won’t actually understand how our users are experiencing our system. For example, all these plots produce the same average but have a very different distribution of how our users experienced the system.
Seriously, always use percentiles.
So when you set up latency alerts for individual methods, keep two things in mind:
- Use the Latency metric instead of IntegrationLatency. IntegrationLatency measures the response time of the integration target (e.g. Lambda) but doesn’t include any overhead that API Gateway adds. When measuring API latency, you should measure the latency as close to the caller as possible.
- Use the 90th, 95th, or 99th percentile. Or maybe use all 3, but set different threshold levels for them. For example, p90 Latency at 1 second, p95 Latency at 2 seconds, and p99 Latency at 5 seconds.
4xx rate/5xx rate alert
When you use the Average statistic for API Gateway’s 4XXError and 5XXError metrics you get the corresponding error rate. Set up alerts against these to alert yourself when you start to see an unexpected number of errors.
SQS
When working with SQS, you should set up alerts against the ApproximateAgeOfOldestMessage metric for an SQS queue. It tells you the age of the oldest message in the queue. When this metric trends upwards, it means your SQS function is not able to keep pace with the rate of new messages.
Step Functions
There are a number of metrics that you should alert on:
ExecutionThrottledExecutionsAbortedExecutionsFailedExecutionsTimedOut
They represent the various ways state machine executions would fail. And since Step Functions are often used to model business-critical workflows, I would usually set the alert threshold to 1.
Can you codify these?
Yes, you can!
Here at Lumigo, we have published an Open Source project called cloudwatch-alarms-macro to do just that. It’s a macro that lets you define organization defaults for alert thresholds and generate alerts for resources you have in your CloudFormation stack.
The quickest way to get started is to deploy the macro to your AWS account via the Serverless Application Repository here. After that, you can follow the examples to configure your default thresholds and override them per stack.
Get a free Lumigo account and set up alerts instantly: Sign up to Lumigo.