
When you look at an X-Ray trace for a Lambda cold start, you will see an Initialization subsegment.
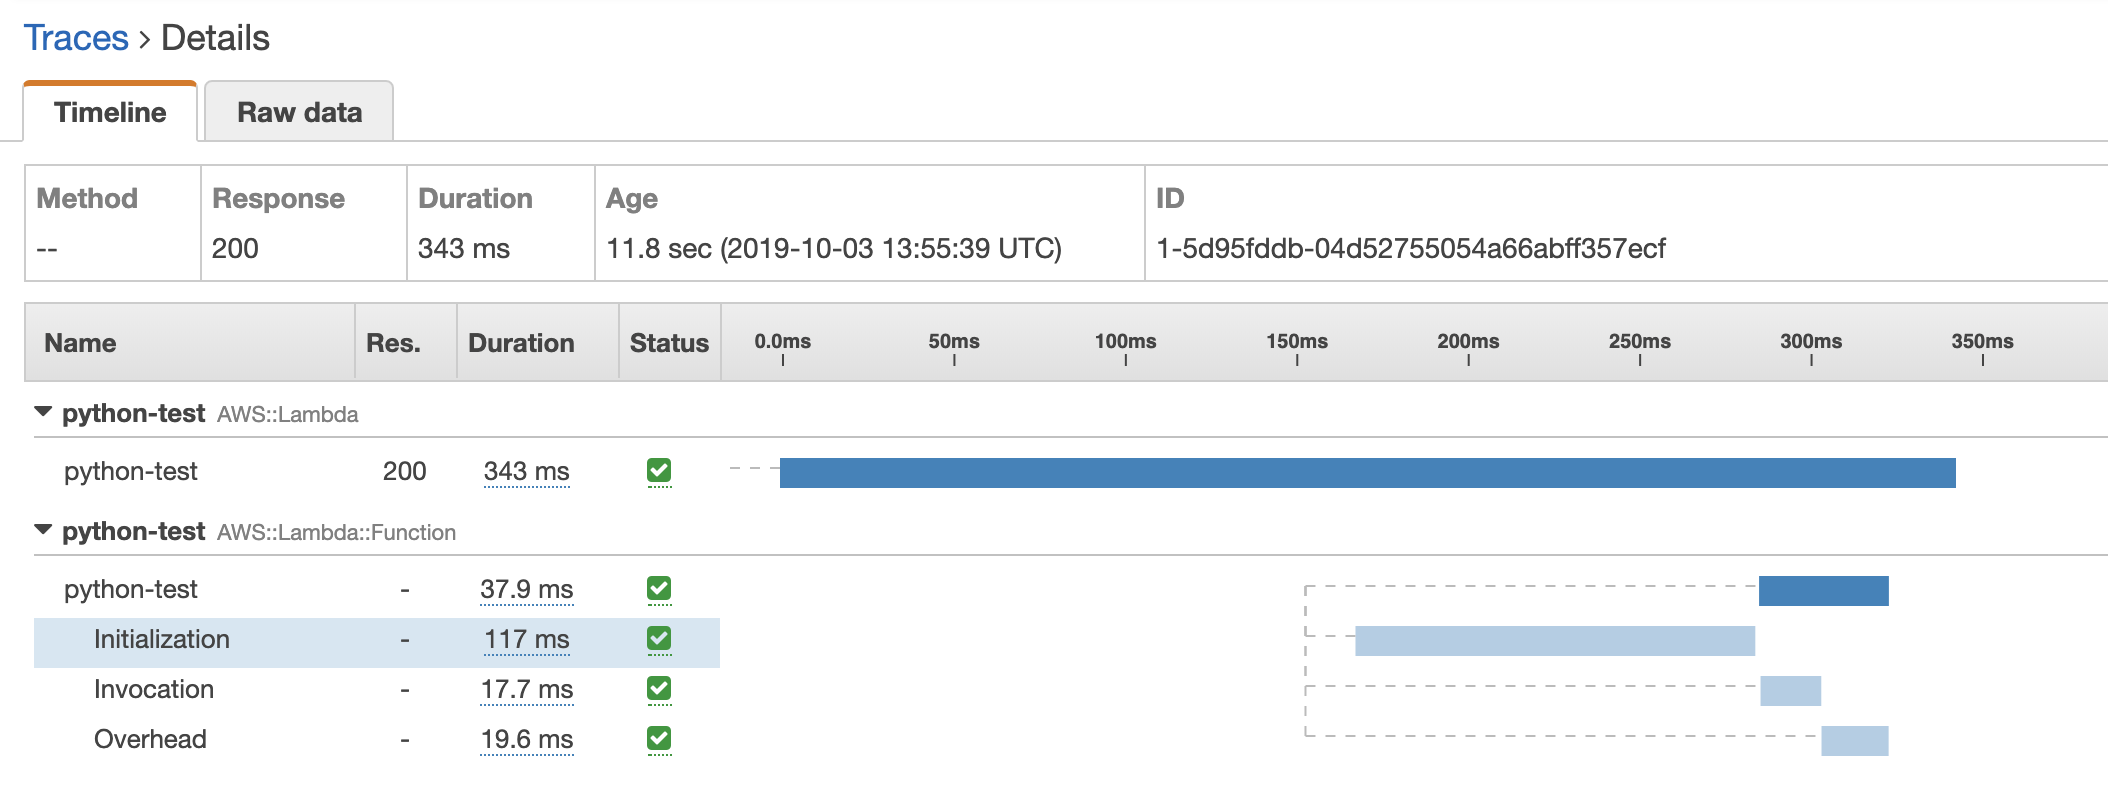
This subsegment represents “the function’s initialization code that is run before the handler”. This is where the runtime would resolve any dependencies, or initialize global variables. These are executed only once, so they don’t have to run on every invocation. The more dependencies you have, the longer this initialization step takes.
You can think of the unlabelled time before the Initialization subsegment as the time it takes AWS to allocate a new container for your function.
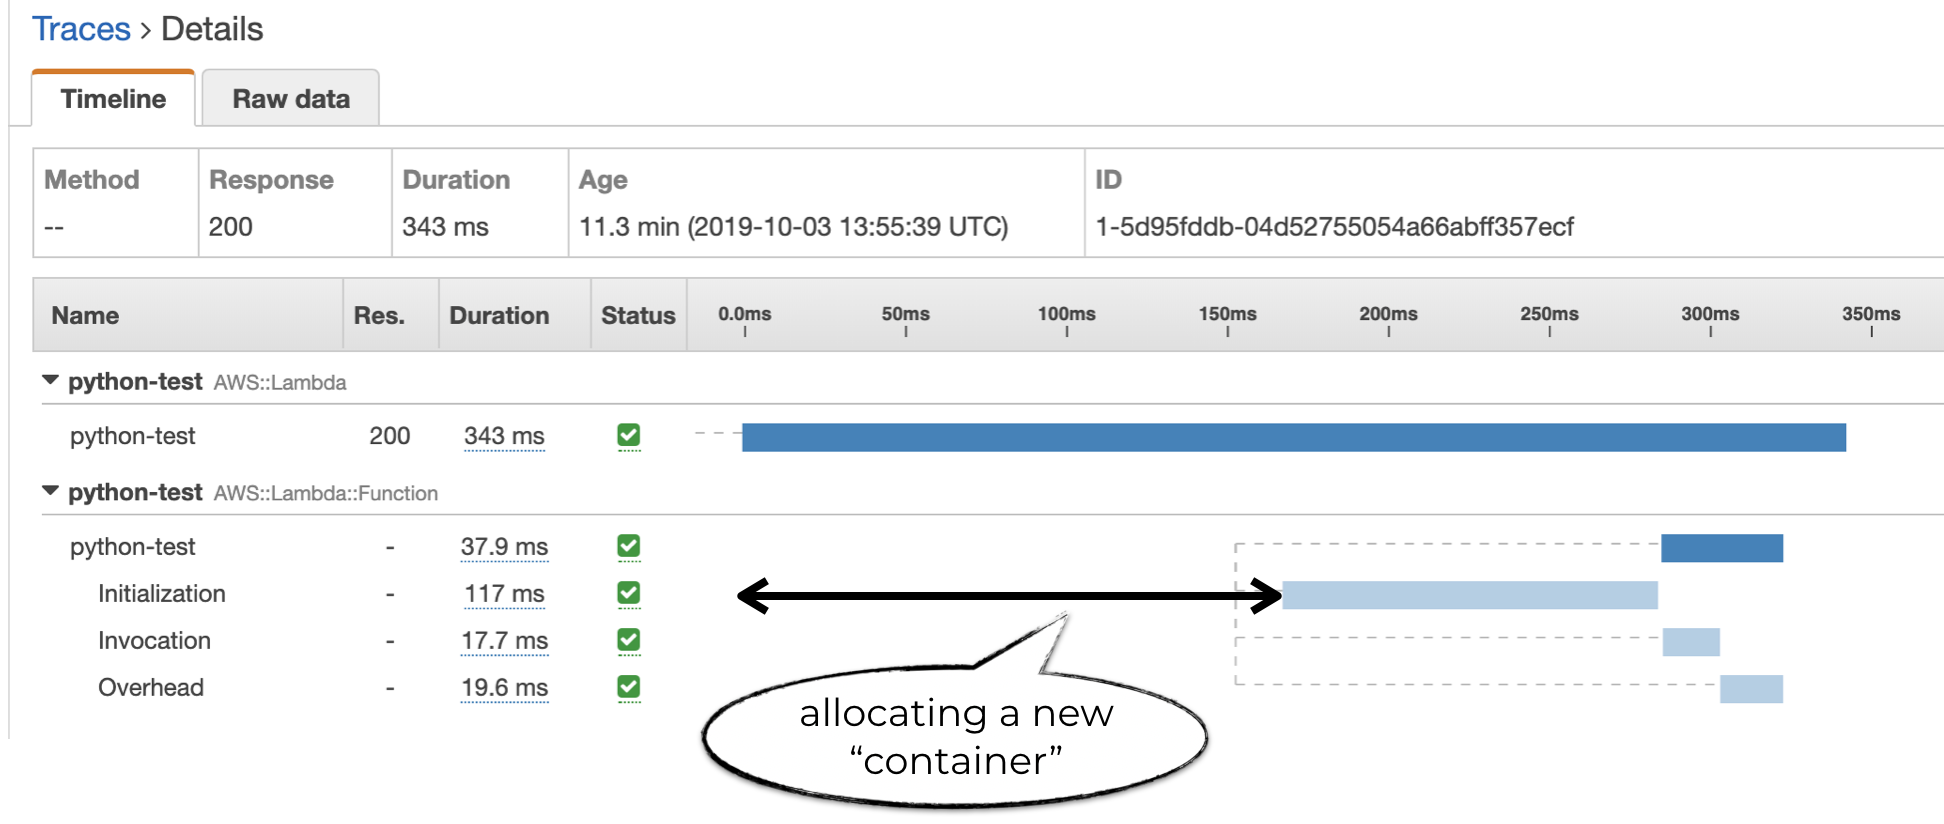
The duration of this allocation time is variable and you have no control over it. Although some experiments suggest that using smaller memory size reduces the allocation time. But it comes at the expense of reduced CPU and IO performance, which in turn can increase the invocation duration instead.
All in and all, you should focus on the Initialization duration when trying to optimize your function’s cold start duration. For instance, here are some techniques to reduce cold start duration for Node.js functions that depend on the AWS SDK.
Recently, Lambda started reporting the initialization duration as part of the REPORT message at the end of every invocation.

This is great, but it’s a shame that it’s not available as a metric in CloudWatch! Sure, you can create a custom metric filter yourself to extract the information as a metric. But you’d need to create the same metric filter for every log group you ever create.
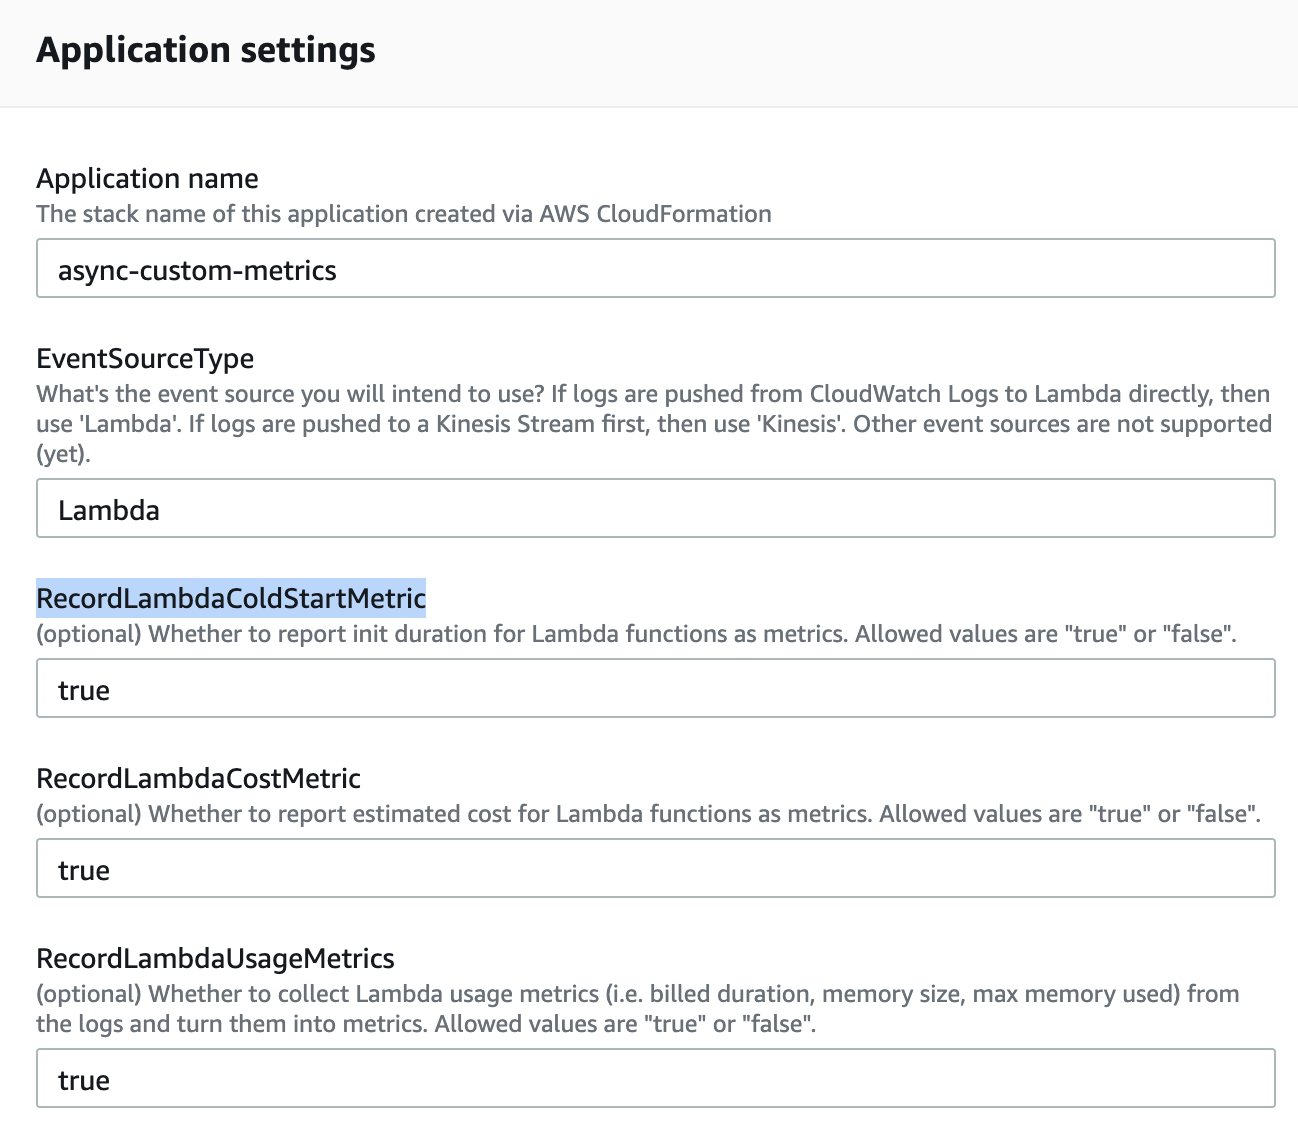
To make it easier for you to monitor the initialization duration of your Lambda functions, we have added support for it in the async-custom-metrics SAR since v1.5.1. When you deploy (or redeploy) the app, set the RecordLambdaColdStartMetric parameter to true.
This app deploys a Lambda function to your account. Once Lambda logs are routed to this function, it’ll parse these REPORT messages and publish the InitDuration as a metric.
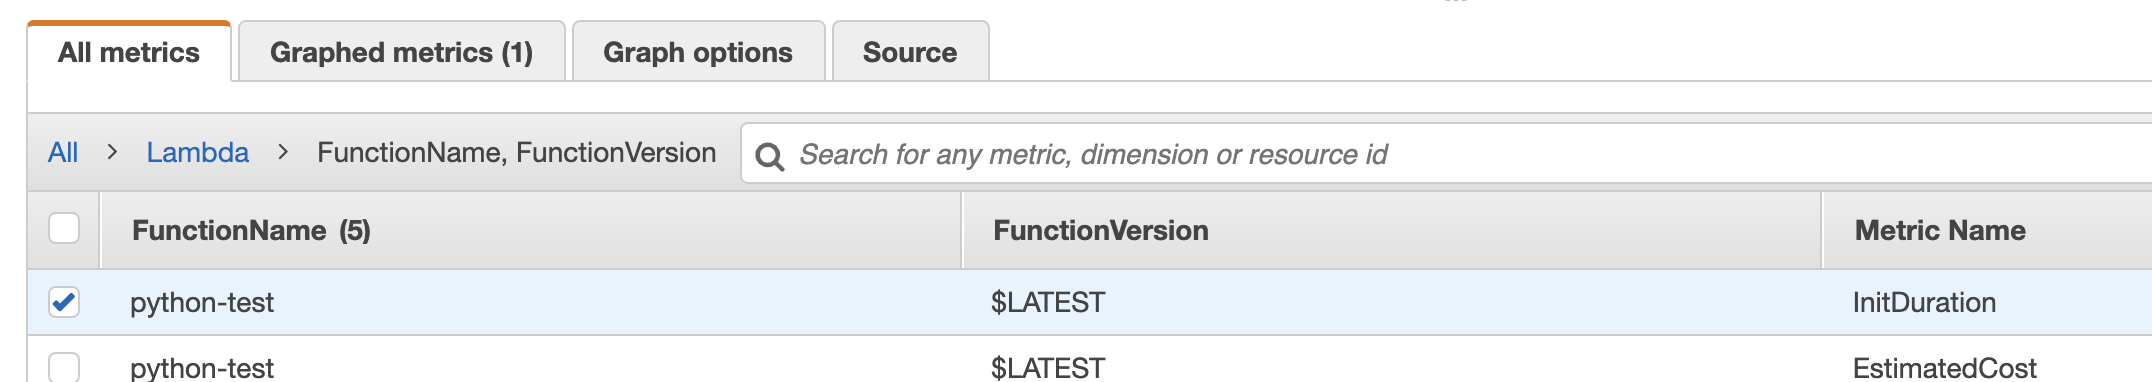
With this, you will be able to monitor the cold start duration for your Lambda functions. And from there, you can identify deviations from the historical norm after a code change and be proactive in optimizing functions with slow cold starts.