


AWS AppSync is a fully managed GraphQL service that makes it easy for you to build scalable and performant GraphQL APIs without having to manage any infrastructure!
With AppSync, you get a lot of capabilities out of the box. Such as the ability to integrate directly with DynamoDB, ElasticSearch, Aurora Serverless, and Lambda. AppSync also supports both per-request as well as per-resolver caching and has built-in integration with CloudWatch and X-Ray.
In this post, let’s explore how you can use these tools to help you monitor your AppSync APIs and debug problems.
Metrics
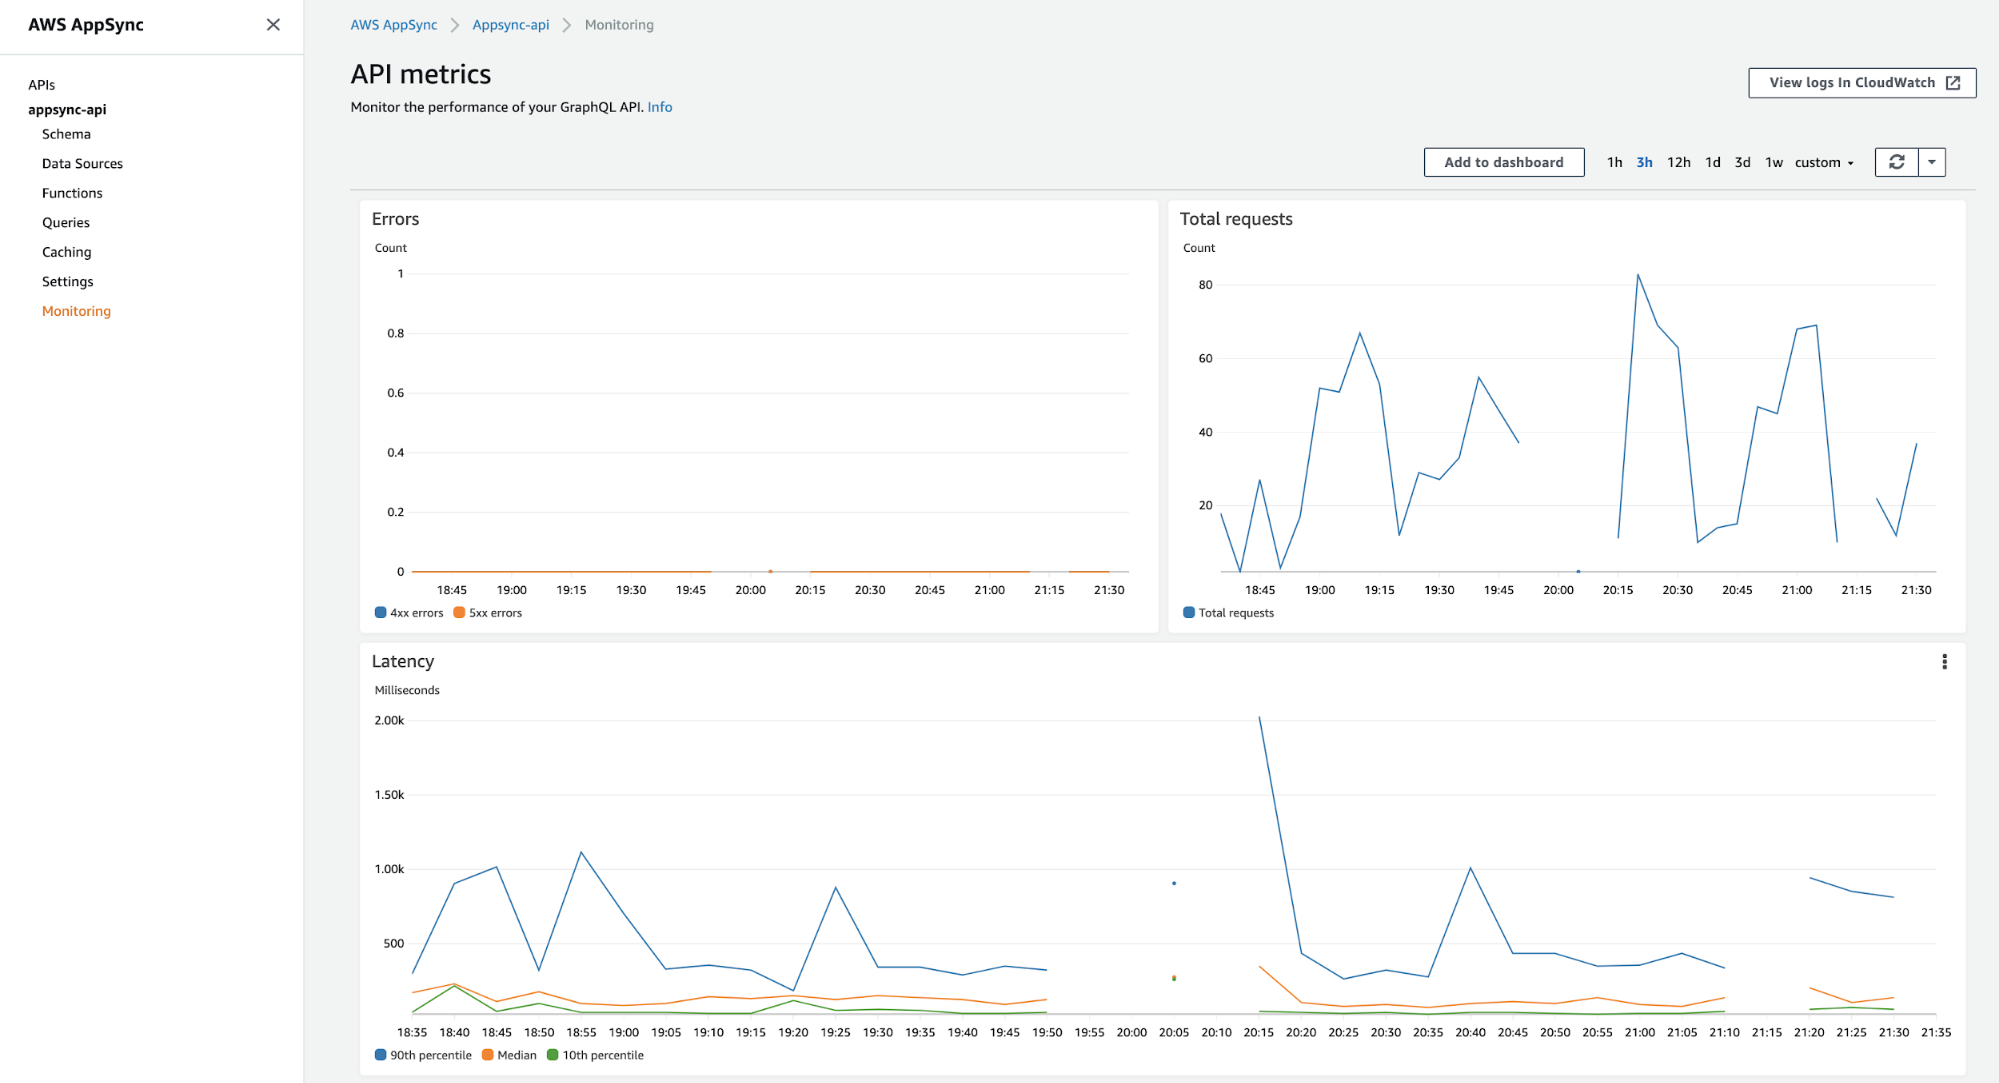
Out of the box, AppSync reports a number of metrics to CloudWatch:
- Number of 4xx errors
- Number of 5xx errors
- Request latency
By looking at the “Sample Count” statistics for any of these metrics, you can also find out the number of API requests.
In the AppSync console, you can see these metrics in the “Monitoring” section.
If you enabled caching, you will get additional system metrics about the cache:
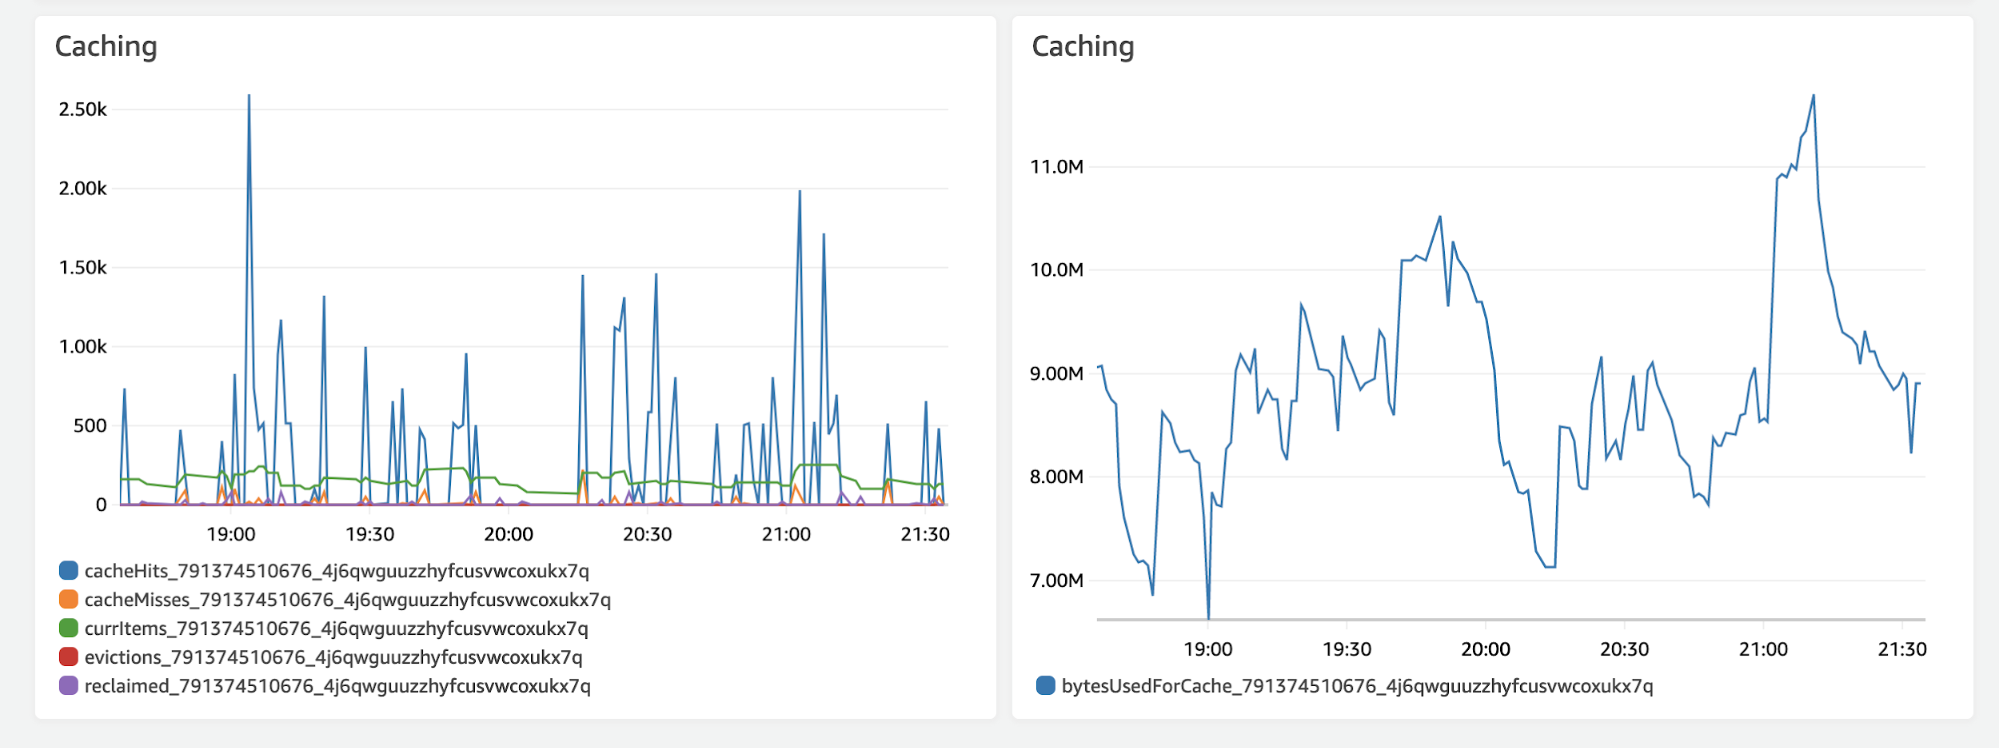
These built-in metrics are useful and give you a sense of what your API is doing and its overall health in terms of latency and error rate. However, as the metrics are aggregated at the API level, it’s impossible to tell how well individual resolvers are performing.
For example, if you see a spike of 5xx errors, you can’t tell from the metrics which resolver is the culprit.
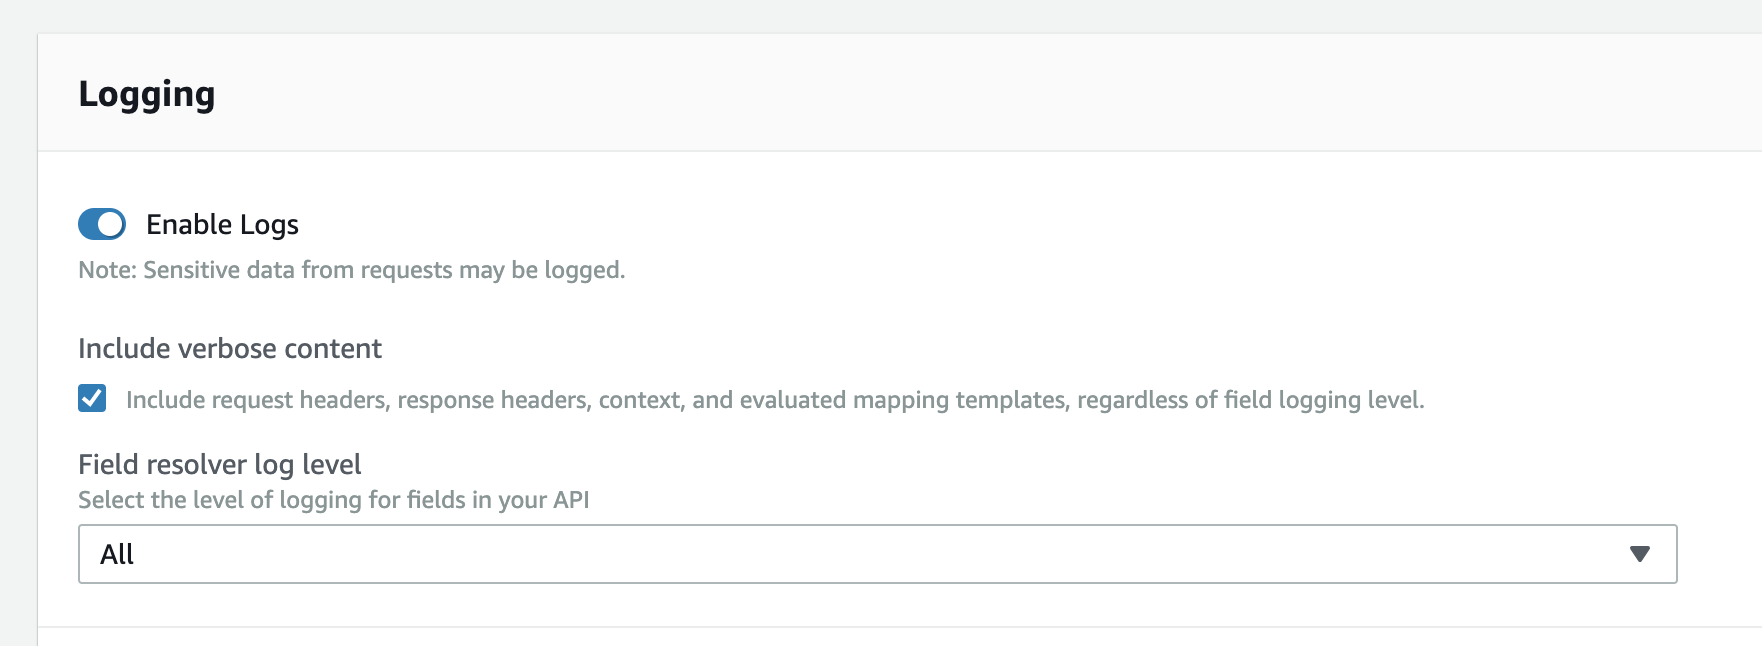
Fortunately, once you enable logging and set the “Field resolver log level” to “All” you will have a lot of visibility into what the resolvers are doing!
Logging
Let’s look at these logging options in more detail and see what they give you.
AppSync can record several types of log messages:
- Request Summary
- Execution Summary
- Tracing
See the official documentation for the schema for each log type and some examples.
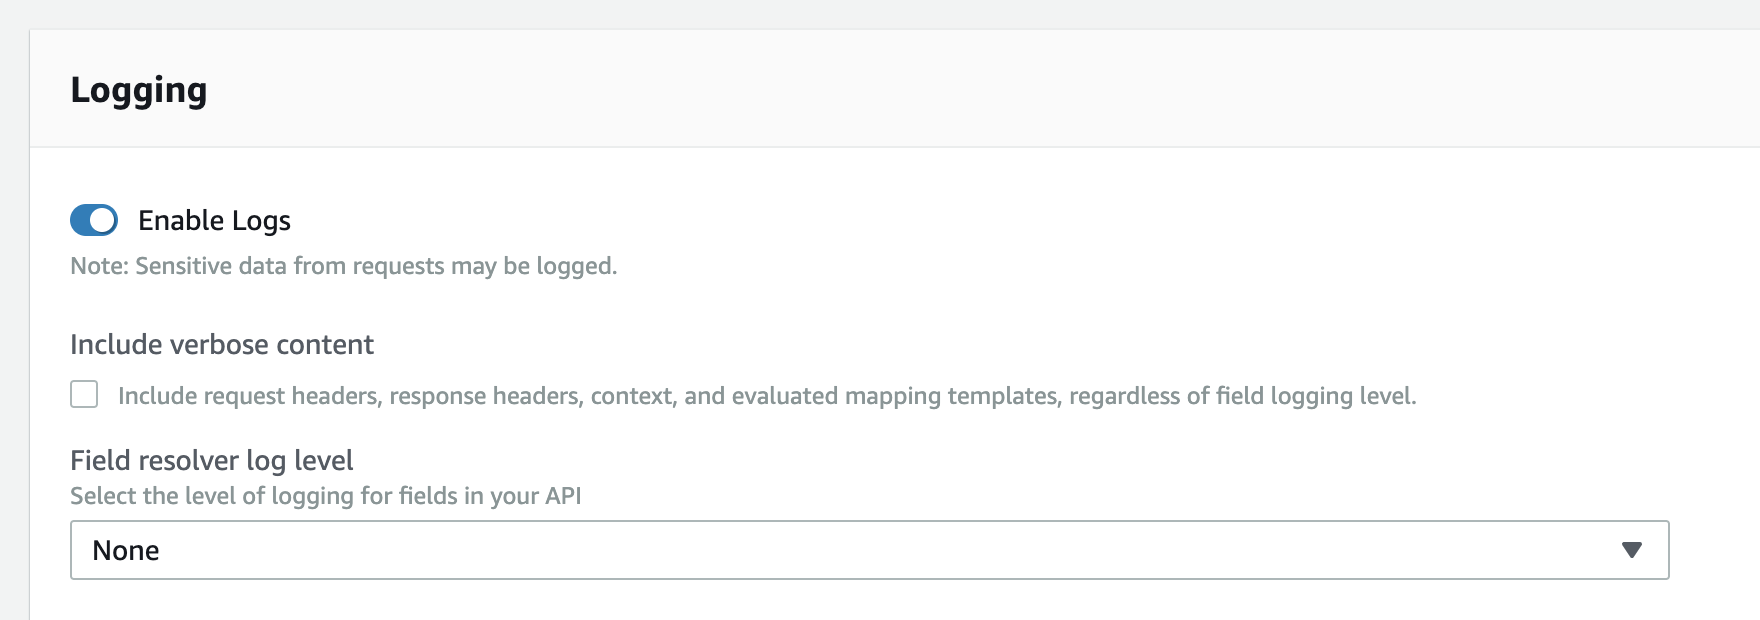
You can enable logs but don’t include verbose content and leave “Field resolver log level” to “None” (as illustrated below).
AppSync records the ExecutionSummary and RequestSummary logs.
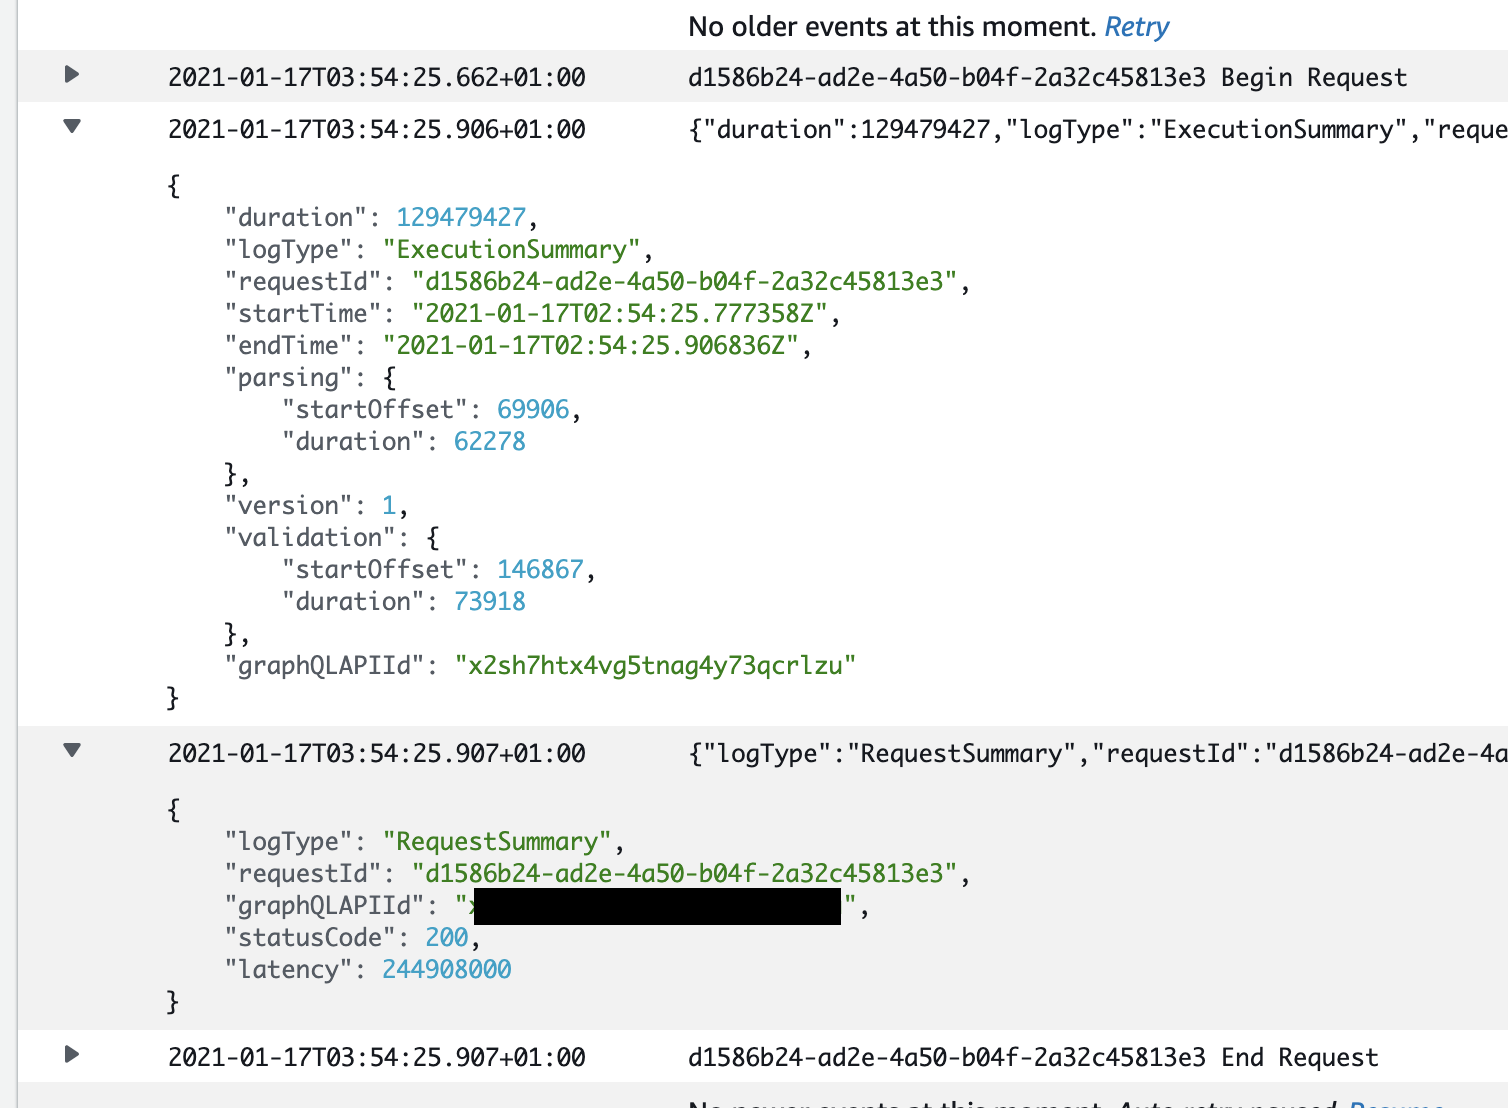
There is some useful information here, including how long the request took in nanoseconds. But you don’t know what was the query, and if the request took a long time to process, which resolver(s) was at fault.
And if you enable “Include verbose content” then you will get additional log messages:
- The GraphQL request
- The request headers
- The response headers
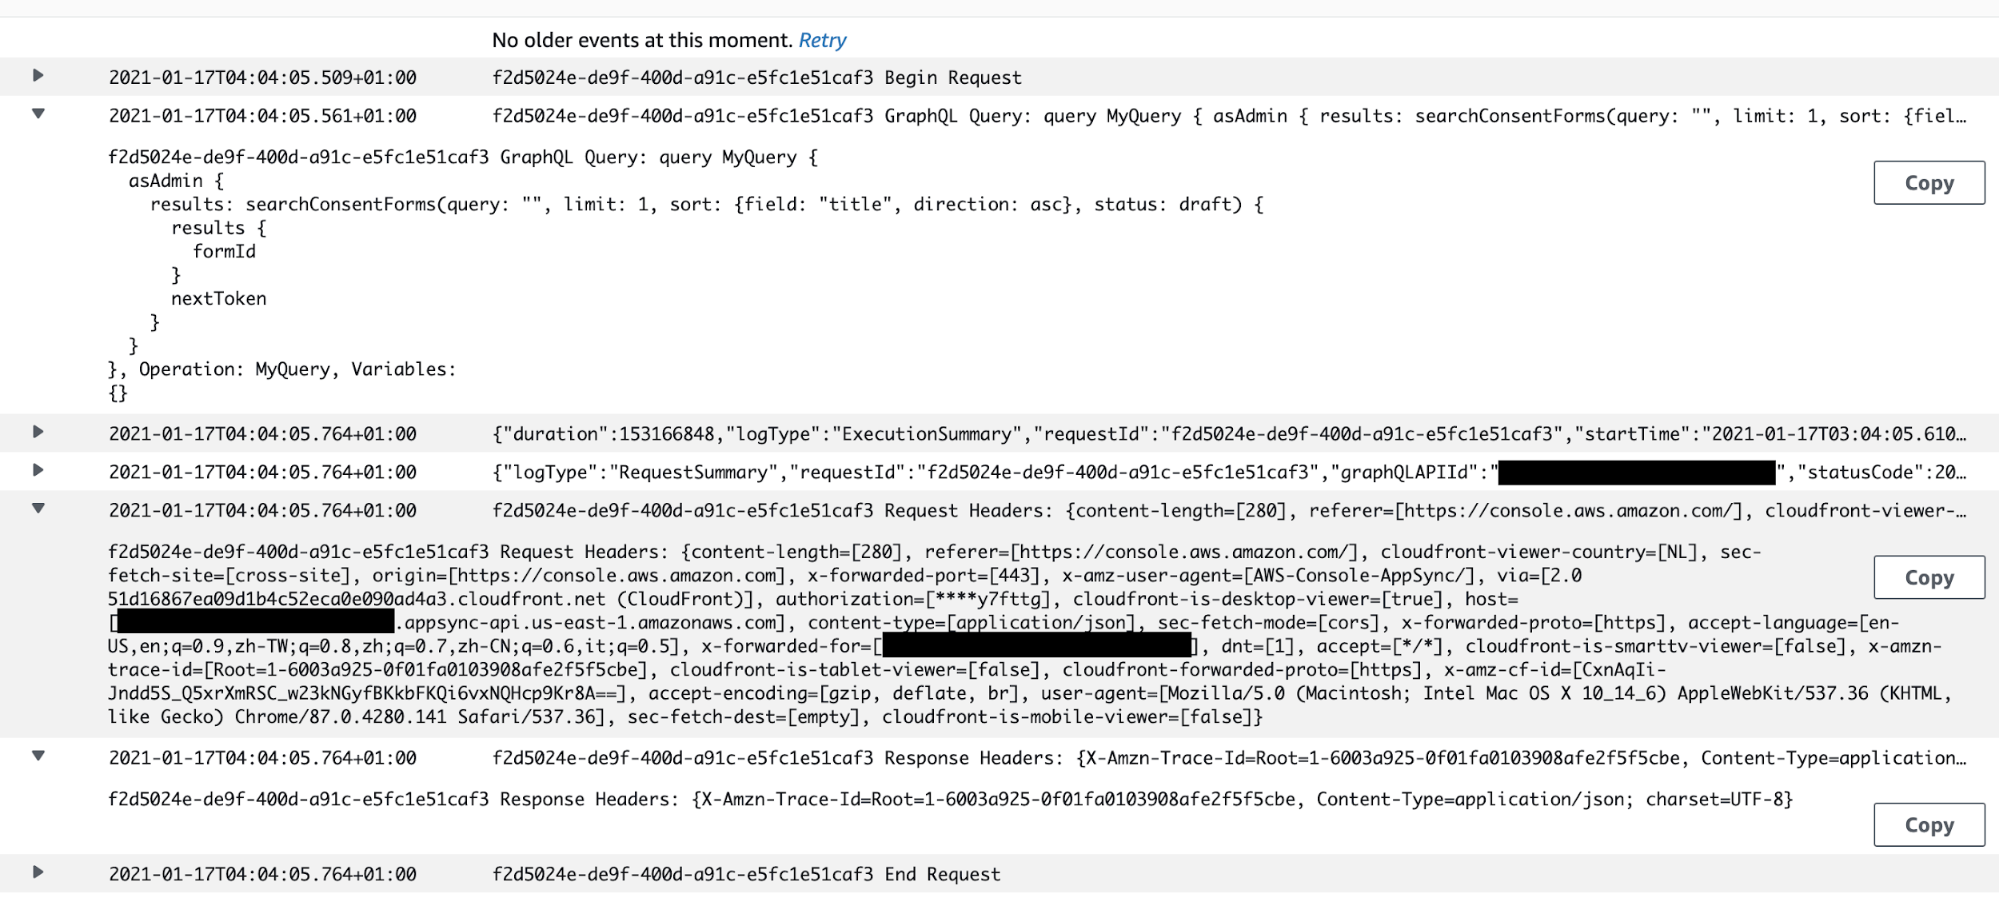
Now you know the query and can associate the request latency to the top-level resolver for a query or mutation operation. But GraphQL operations often involve nested resolvers — and many of them!
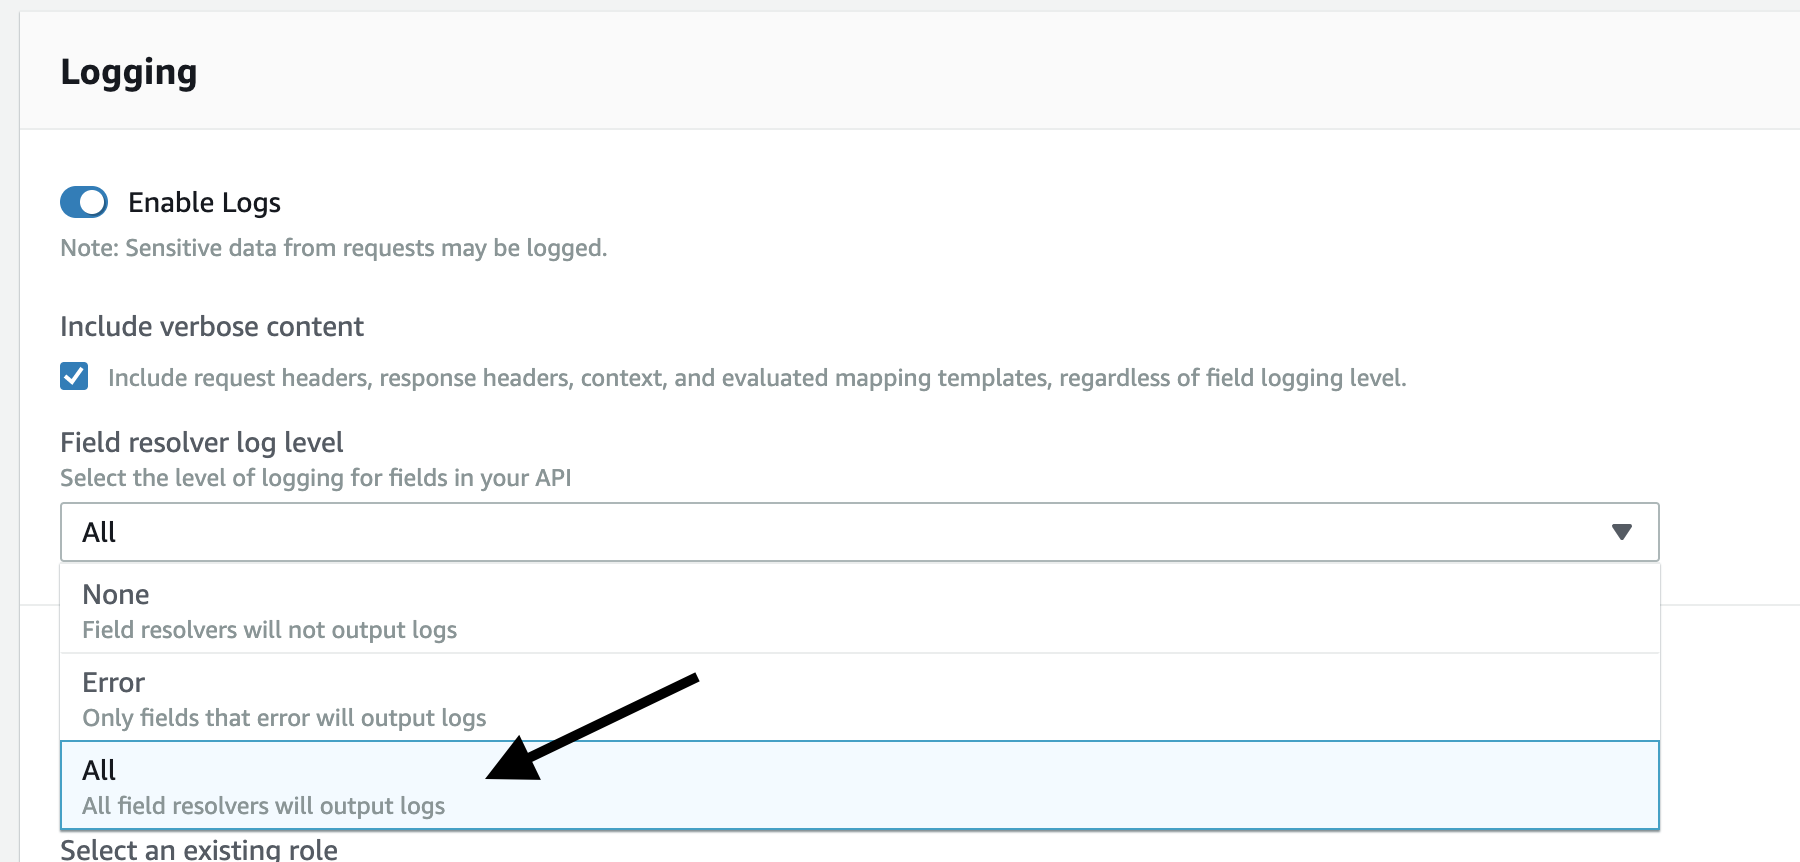
To drill down further into exactly what’s happening when AppSync handles a request, you need to set “Field resolver log level” to “All”.
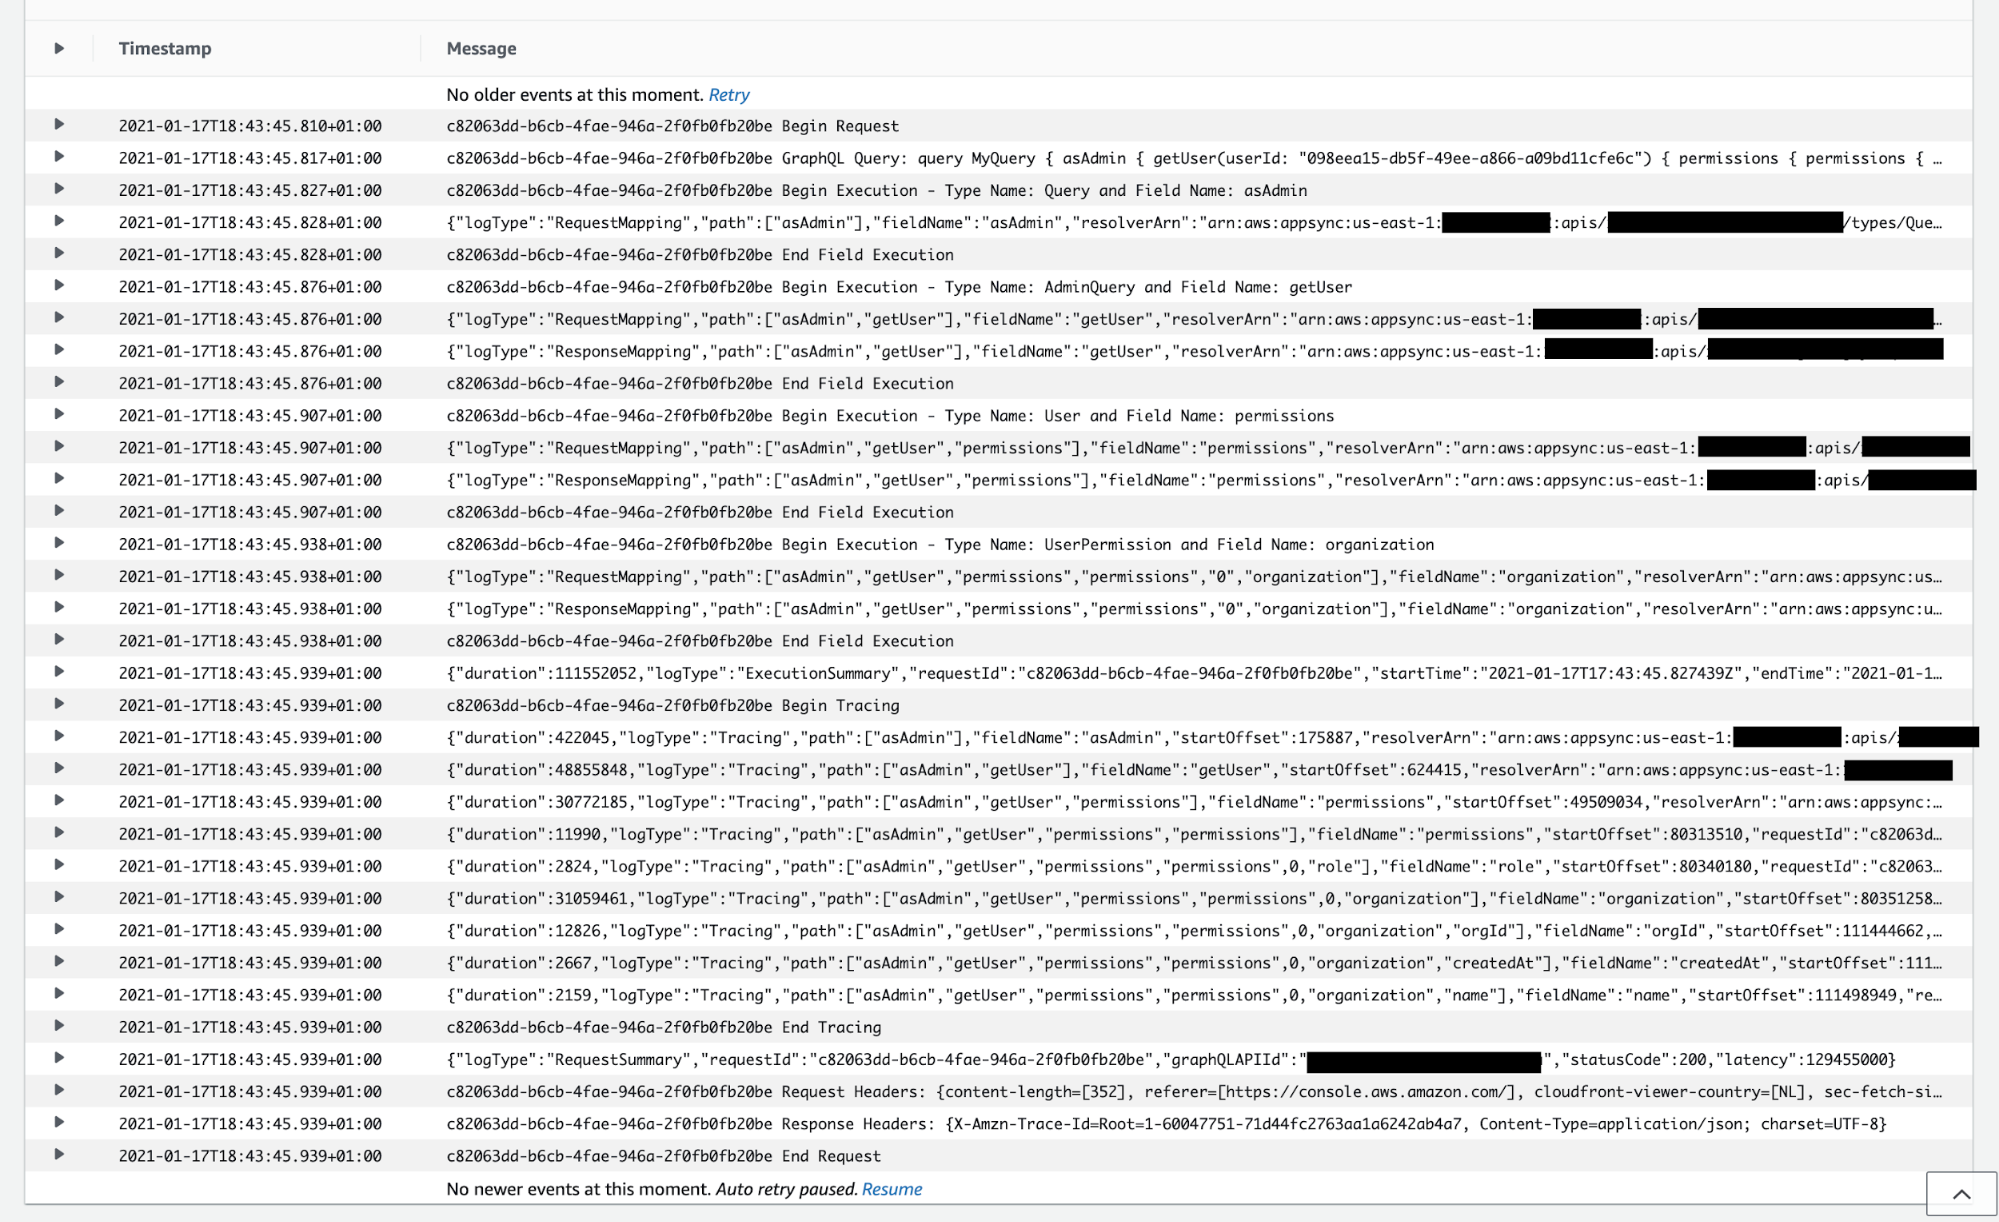
Once you do this, you will see “Tracing” log messages like the following, which traces AppSync’s steps as it evaluates each attribute and reports how long it took in nanoseconds.
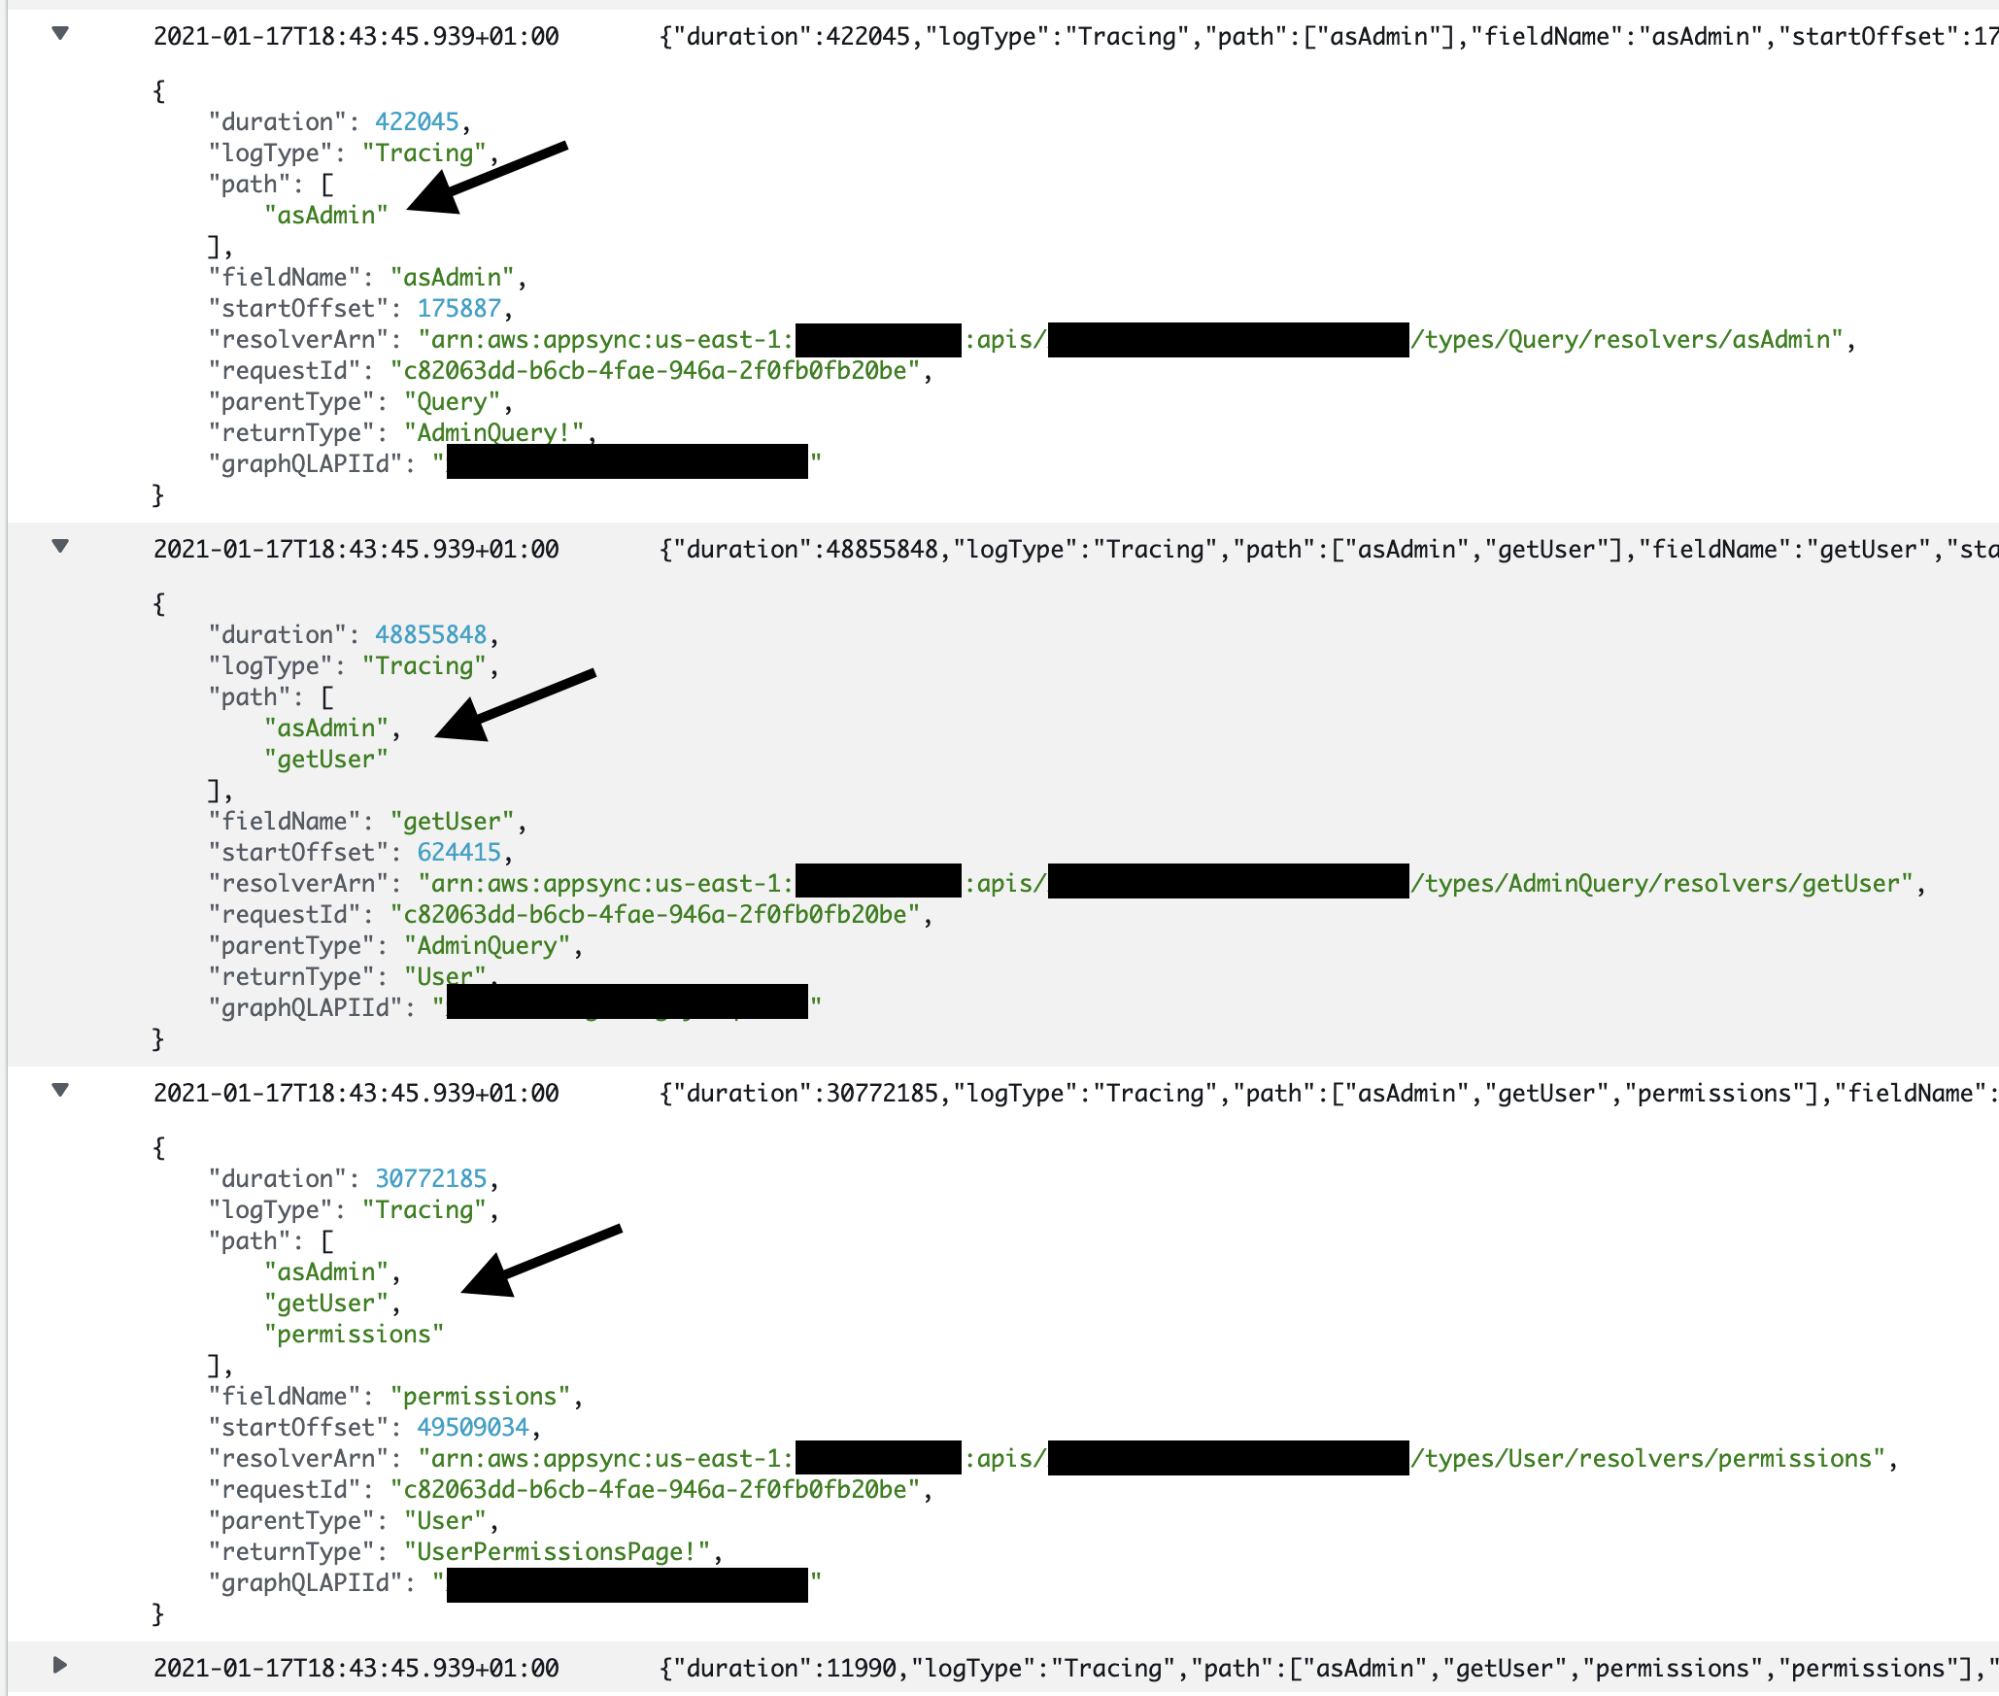
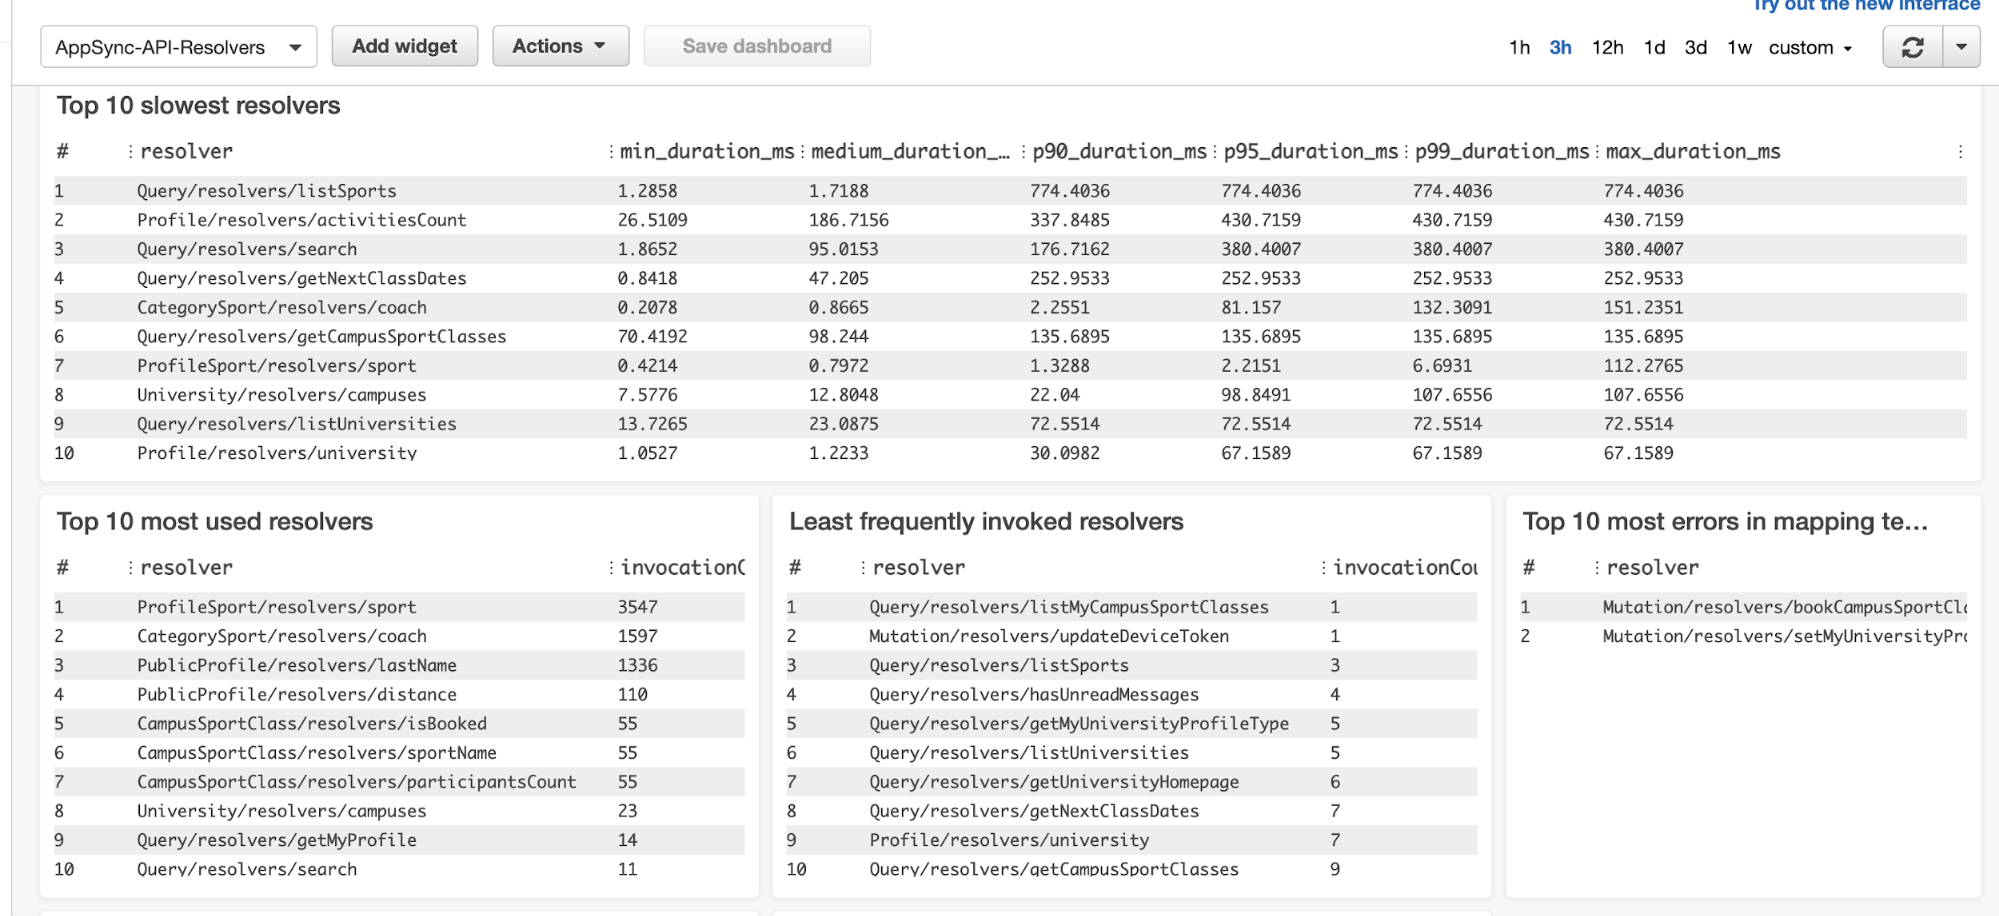
These “Tracing” logs are a useful way to monitor the performance of individual resolvers. You can analyze them with CloudWatch Logs Insights, or even add them to your dashboards. For example, here is a dashboard that shows the top 10 slowest resolvers, the top 10 most used resolvers, and the least used resolvers.
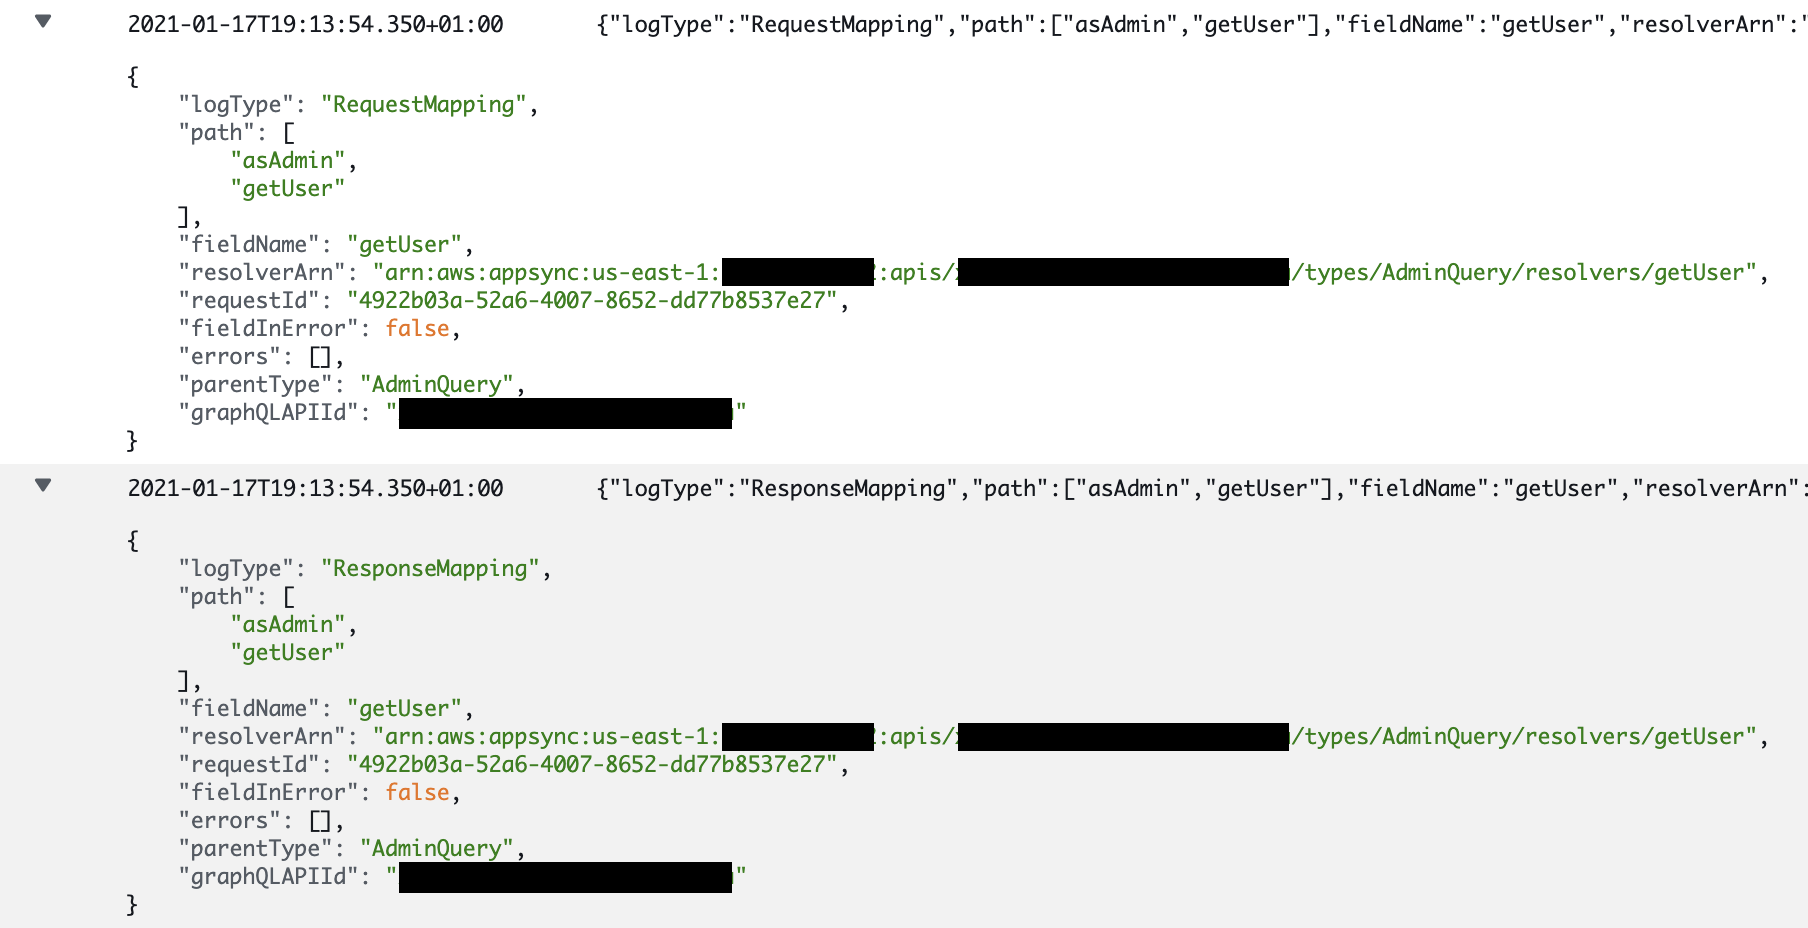
You also get RequestMapping and ResponseMapping logs for resolvers (including nested resolvers). These log messages tell you which resolver is invoked — and depending on if “Include verbose content” is enabled — they will include the value of the $context object as well as the transformed mapping template.
In case you’re wondering, here’s what the RequestMapping and ResponseMapping logs look like when “Include verbose content” is disabled.
And this is when “Include verbose content” is enabled:
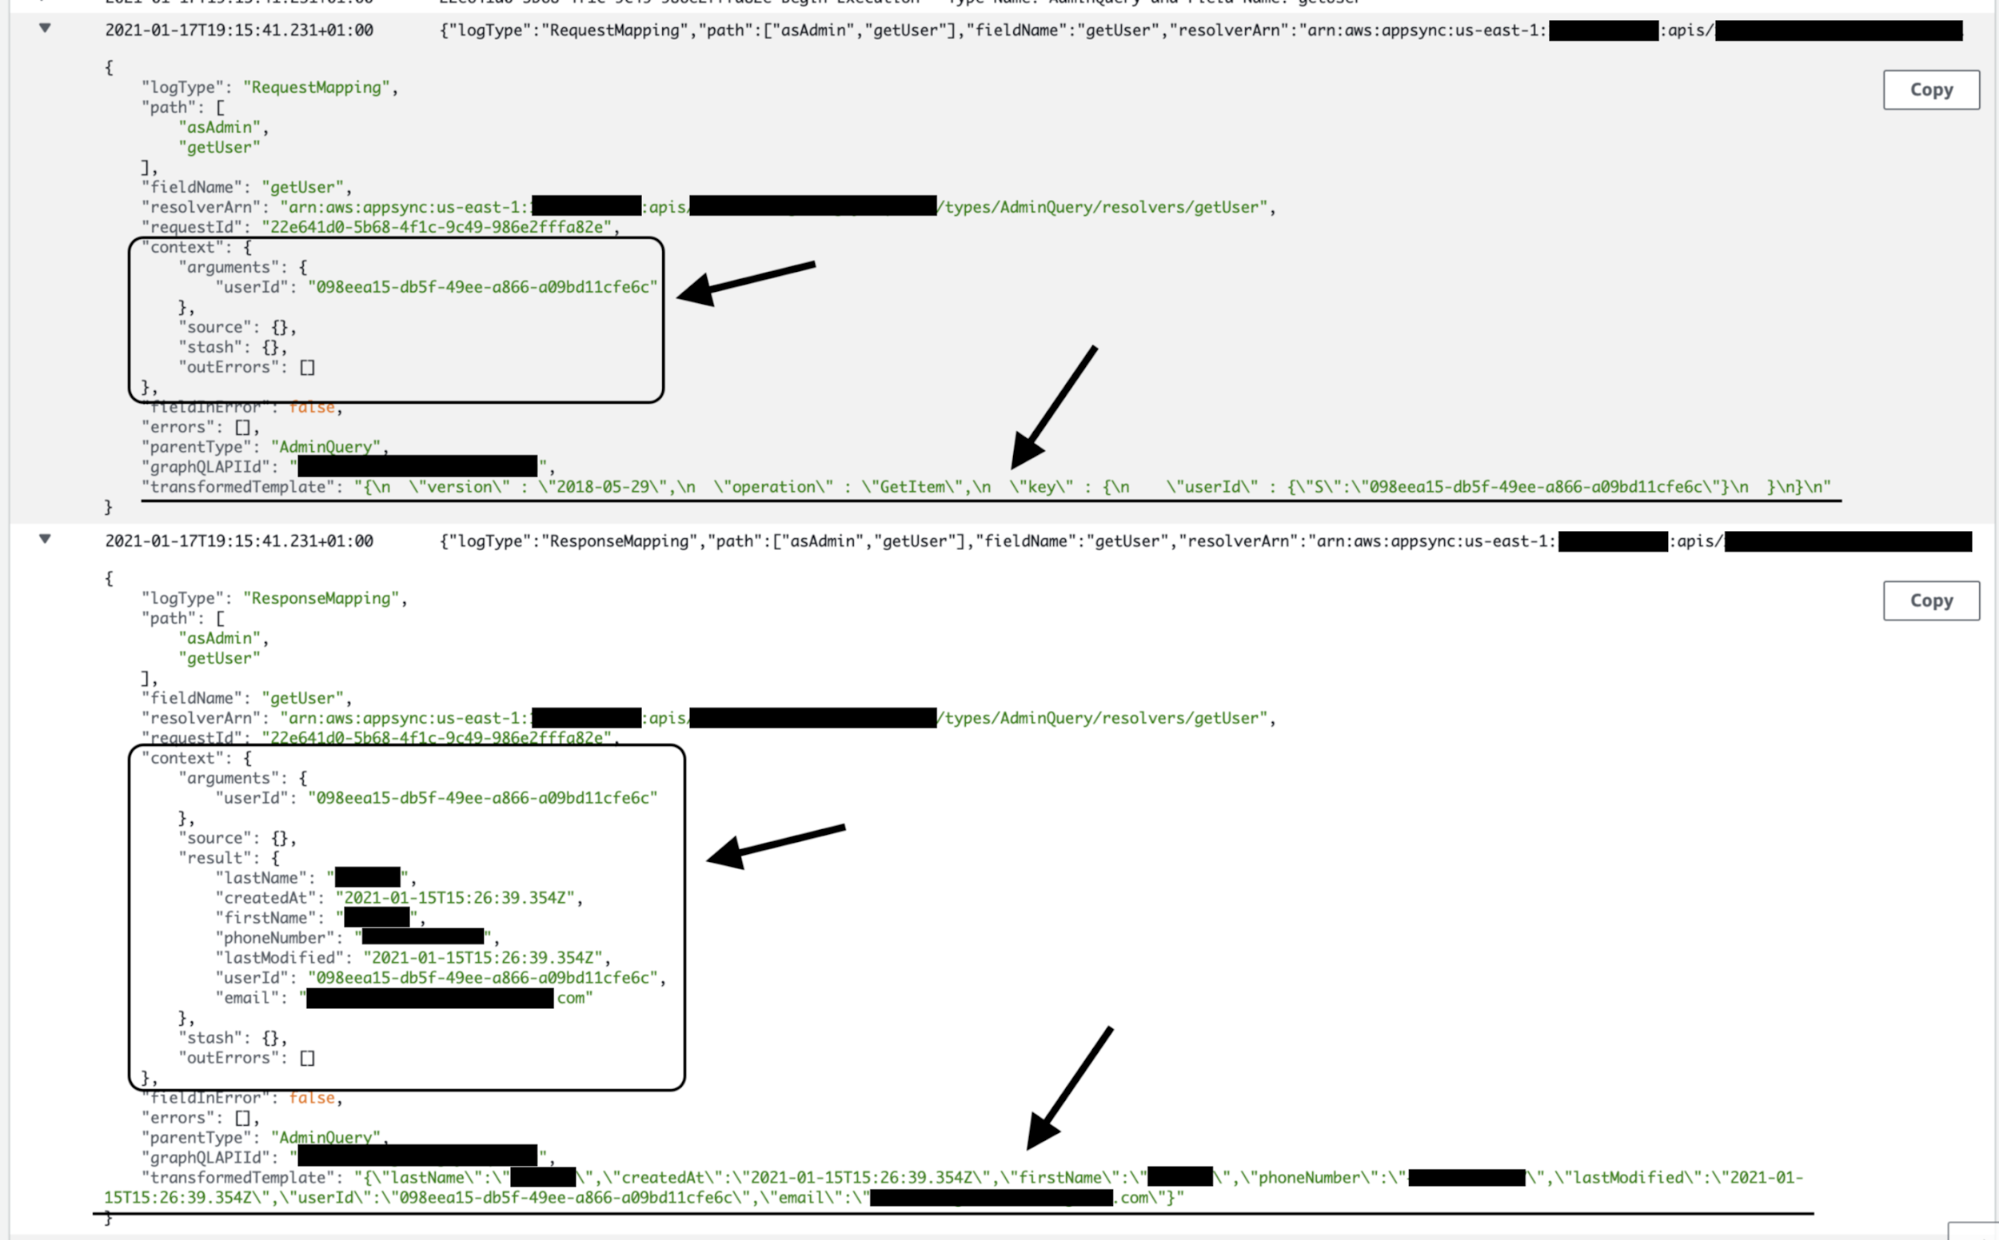
This information is a godsend when it comes to debugging tricky problems in production as you can see exactly what’s in the $context object when a resolver runs. And if you’re dealing with a DynamoDB resolver, you can also see the transformed template, which allows you to identify problems in your VTL template.
These resolver logs are a powerful resource to help you understand what’s going on in your AppSync API and debug problems. However, when they’re enabled and set to “All” the sheer volume of logs can be a significant cost concern in a production environment.
Look at how many logs are recorded for a simple GraphQL query that involved only two resolvers. A more complex query can easily generate 10 times as many logs for a single GraphQL operation.
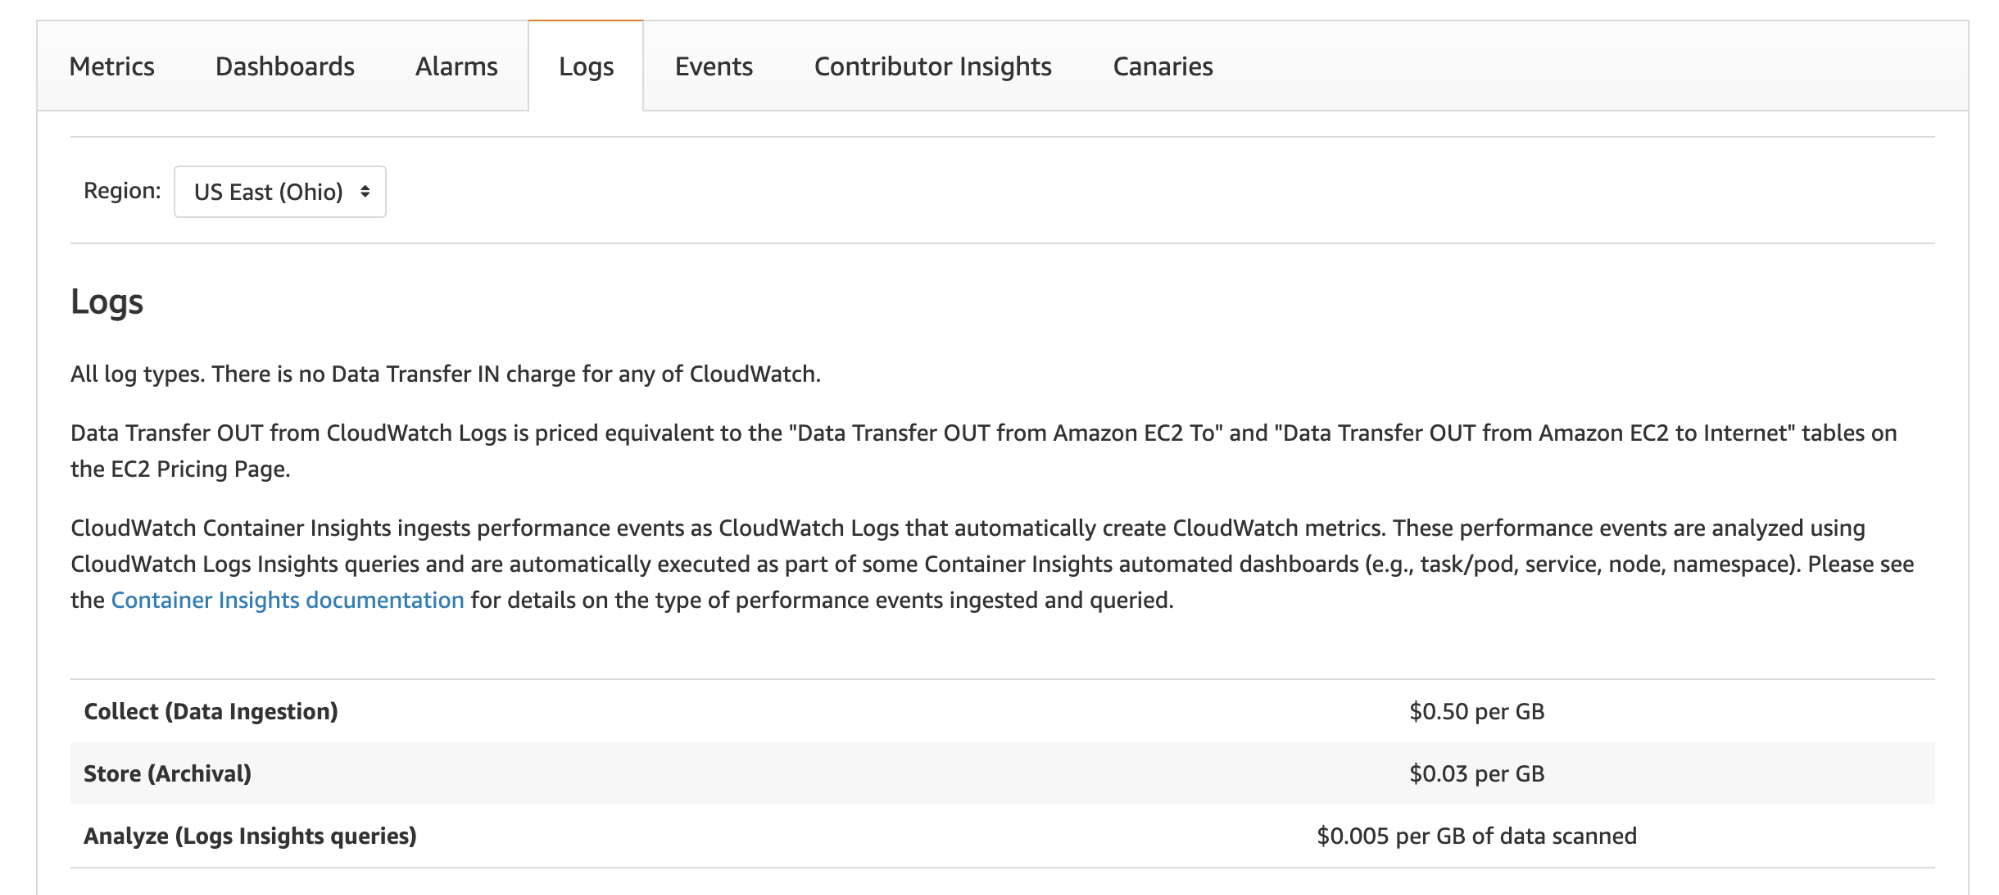
CloudWatch Logs charges you $0.50 per GB of data ingested. Given the number of logs that are generated when field resolver logs are enabled, this can easily cost far more than AppSync, Lambda, and DynamoDB costs combined.
This is why you should consider leaving “Field resolver log level” at “Error” or use some mechanism to sample the full resolver logs. Hopefully, the AppSync team will introduce some built-in mechanism for sampling resolver logs.
AWS X-Ray and AppSync
Finally, AppSync also integrates with X-Ray and records trace segments in X-Ray.
You can see the same breakdown of execution times in a timeline graph. This makes it easy to spot performance bottlenecks and figure out why a request was slow.
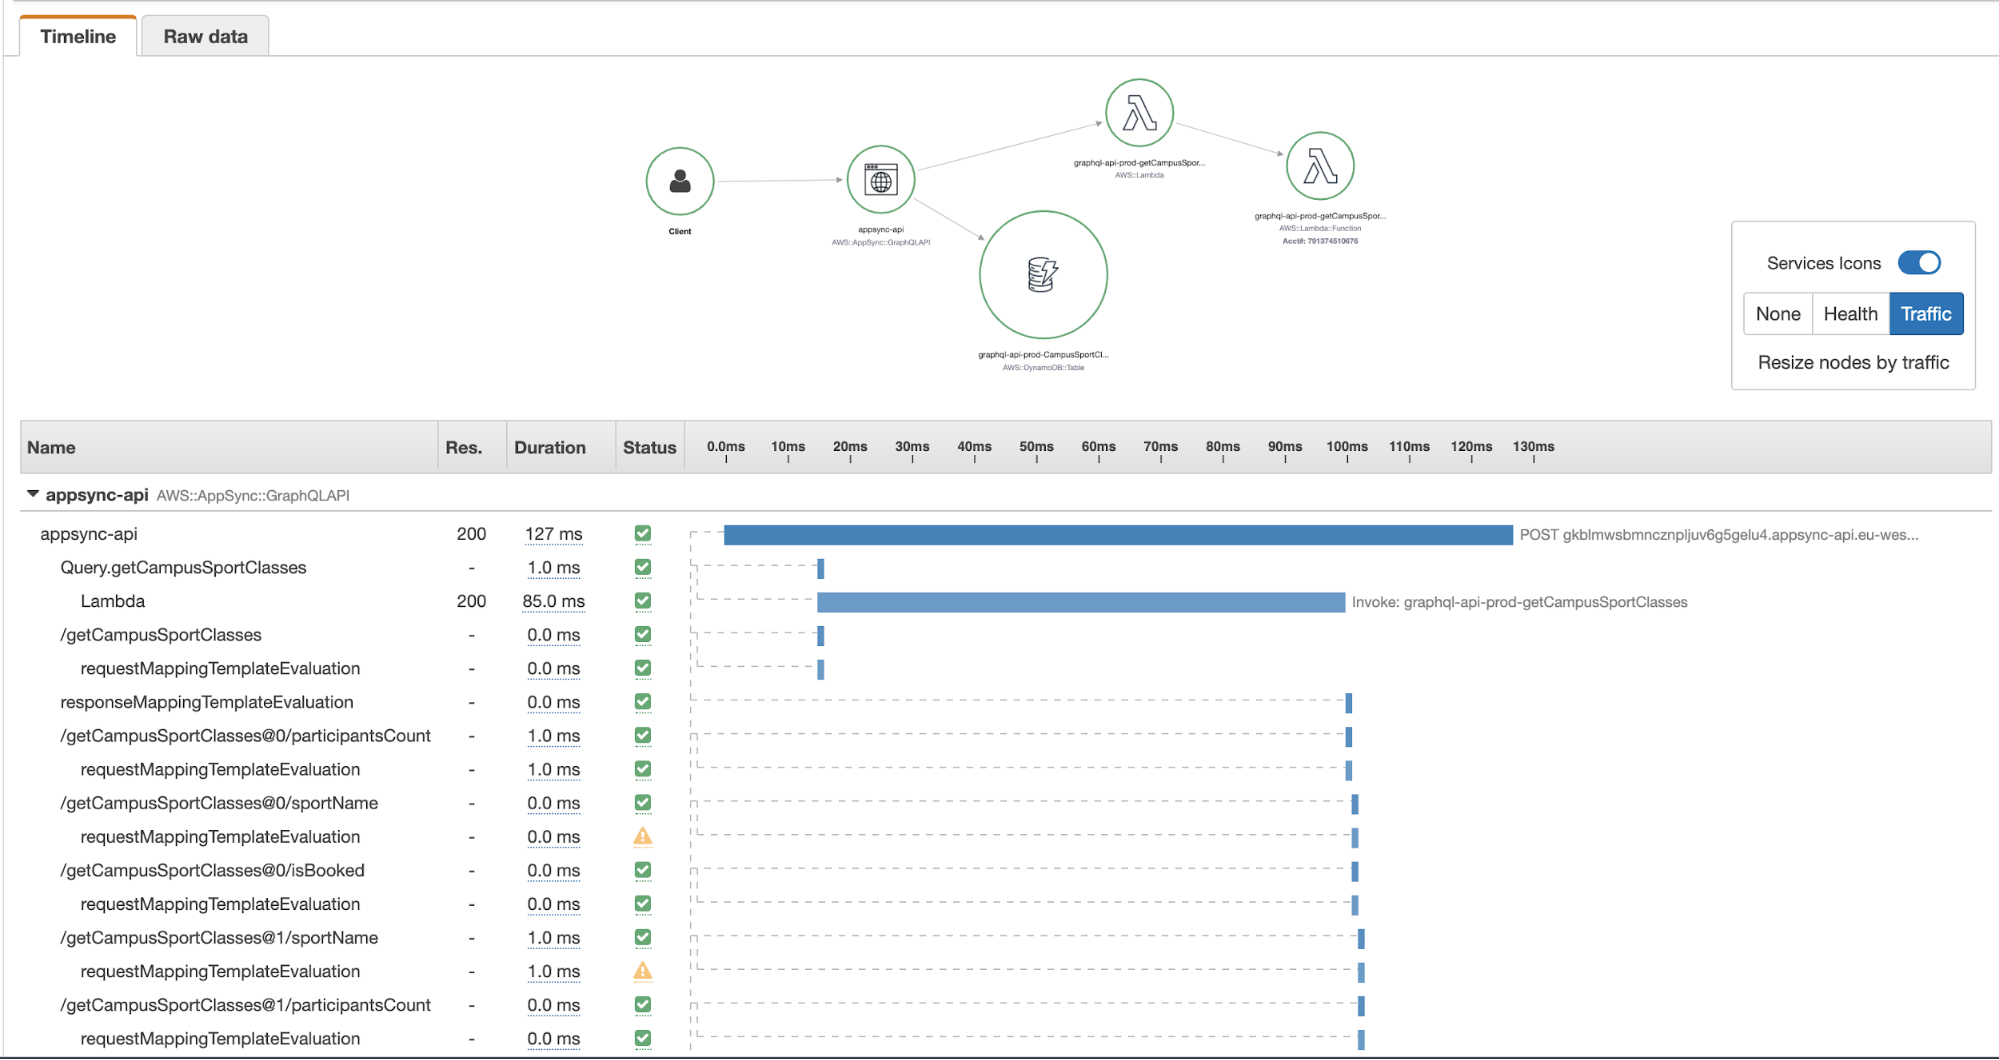
This is essentially another view of the “Tracing” logs data we saw previously, but organized in such a way that we can immediately understand. Clicking on each segment provides more information.
However, whereas the RequestMapping and ResponseMapping logs show us the internal state of AppSync and the transformed request and response templates, the X-Ray segments seldom contain information that can help us debug problems related to mapping templates.
For example, if you click on a DynamoDB operation, you can see some high-level information about the operation and that’s it.
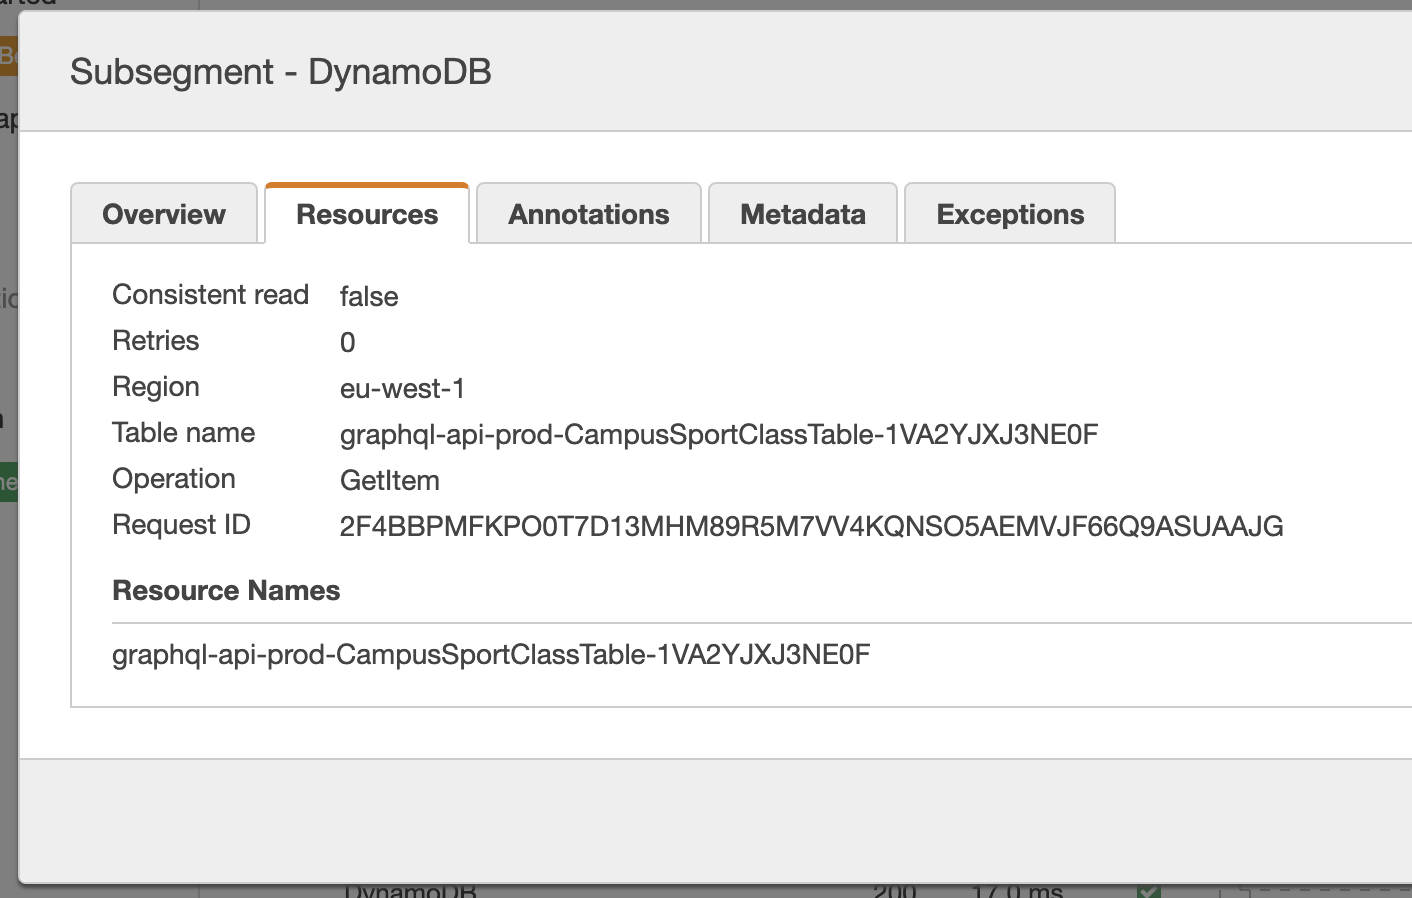
If there was an error in the mapping template logic, you won’t be able to figure out the problem from these alone.
Additionally, X-Ray traces are not organized in such a way that makes it easy for you to find traces related to specific resolvers. Everything is just lumped together under one URL endpoint.
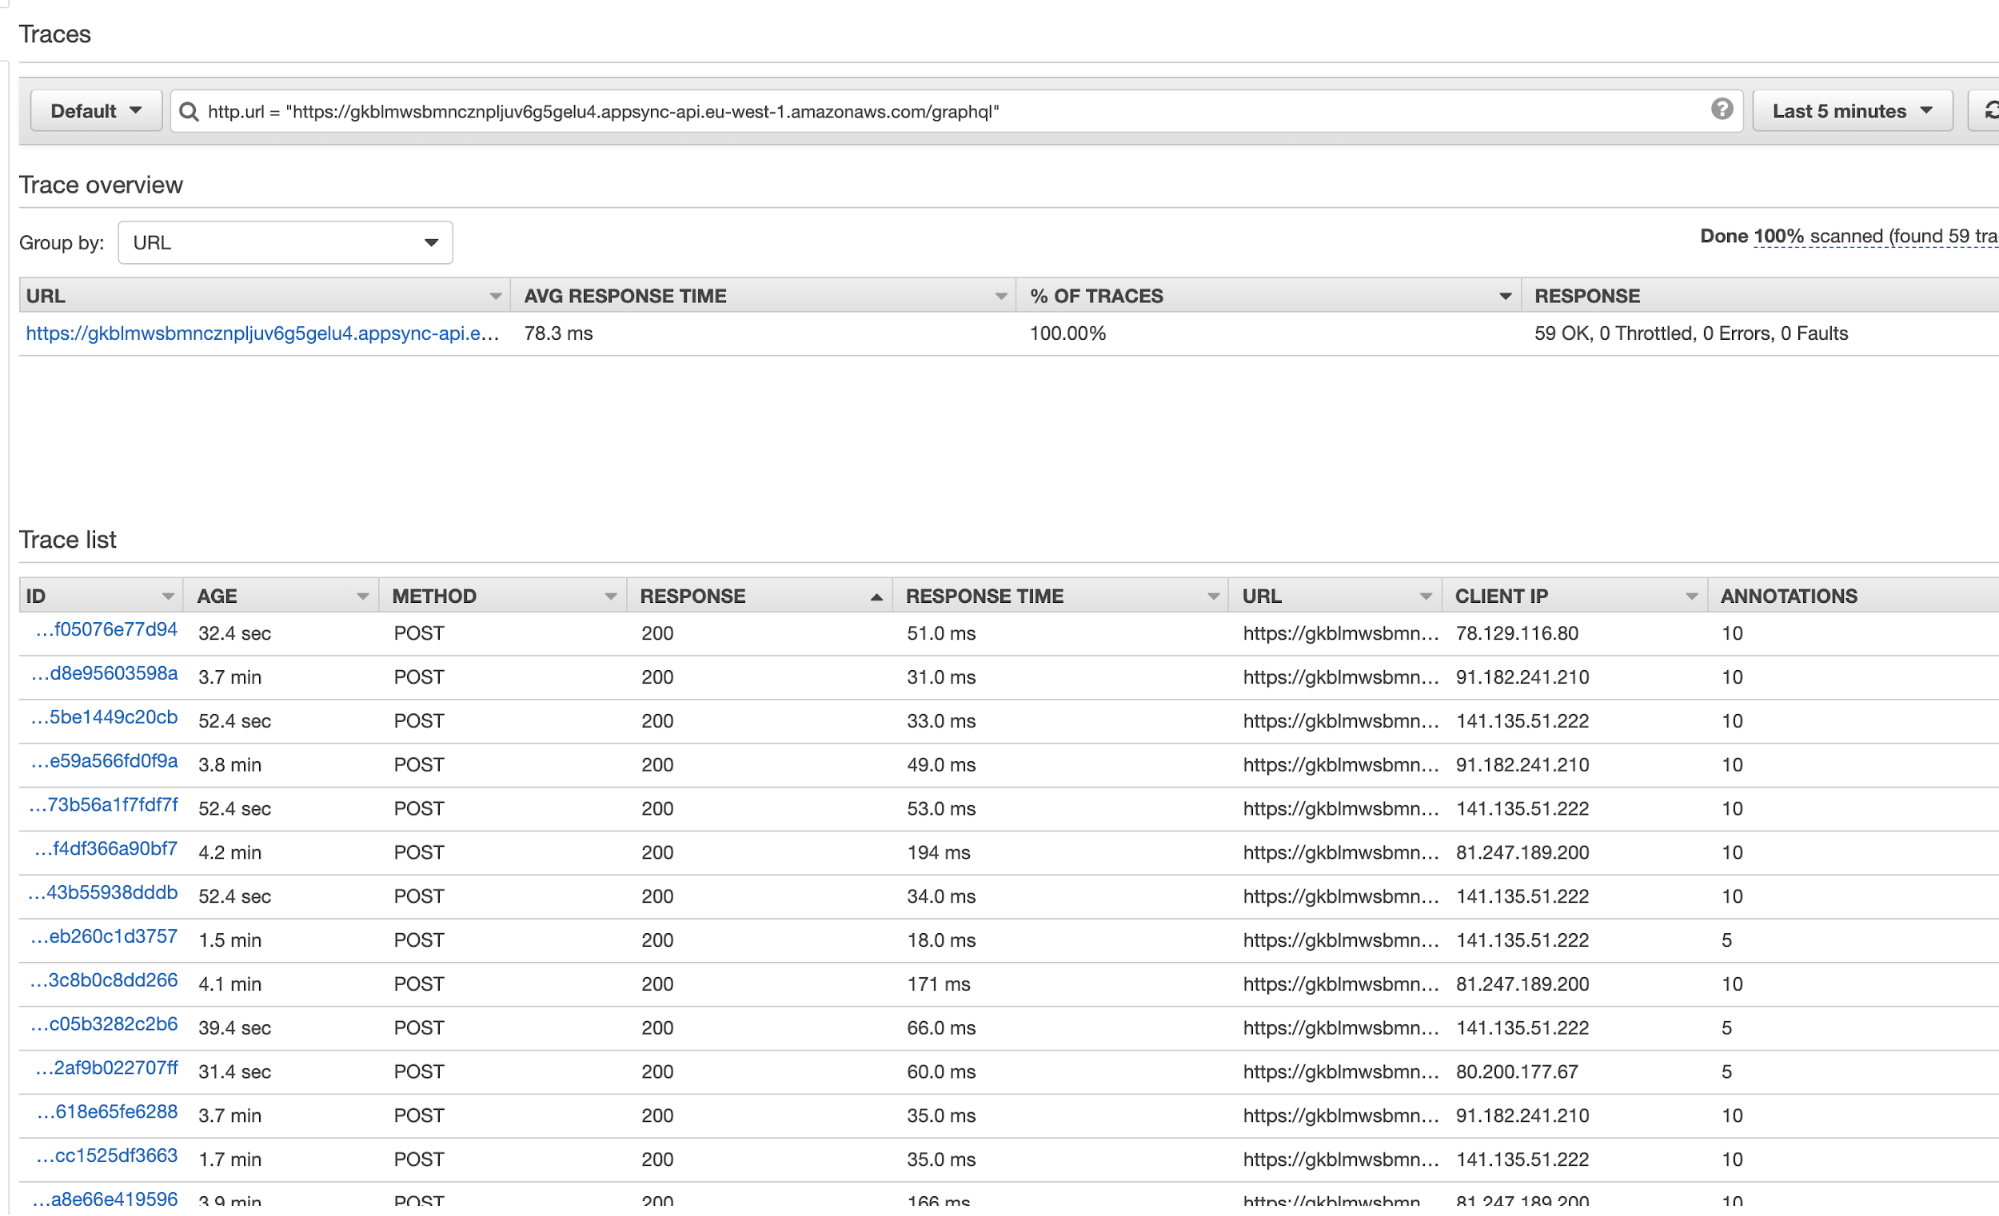
Although X-Ray has a filter expression syntax for finding specific traces, it’s not rich and flexible enough to support GraphQL operations.
At best, I find X-Ray a “sometimes useful” addition to AppSync logs that lets you sometimes stumble upon useful insights. But I can never find the specific information I’m looking for…
This is where Lumigo comes in.
Lumigo and AppSync
Lumigo added support for AppSync which makes much better use of the information that AppSync publishes to CloudWatch Logs and X-Ray.
If you enable AppSync resolver logs and X-Ray integration, Lumigo is able to ingest this information and make it more easily searchable.
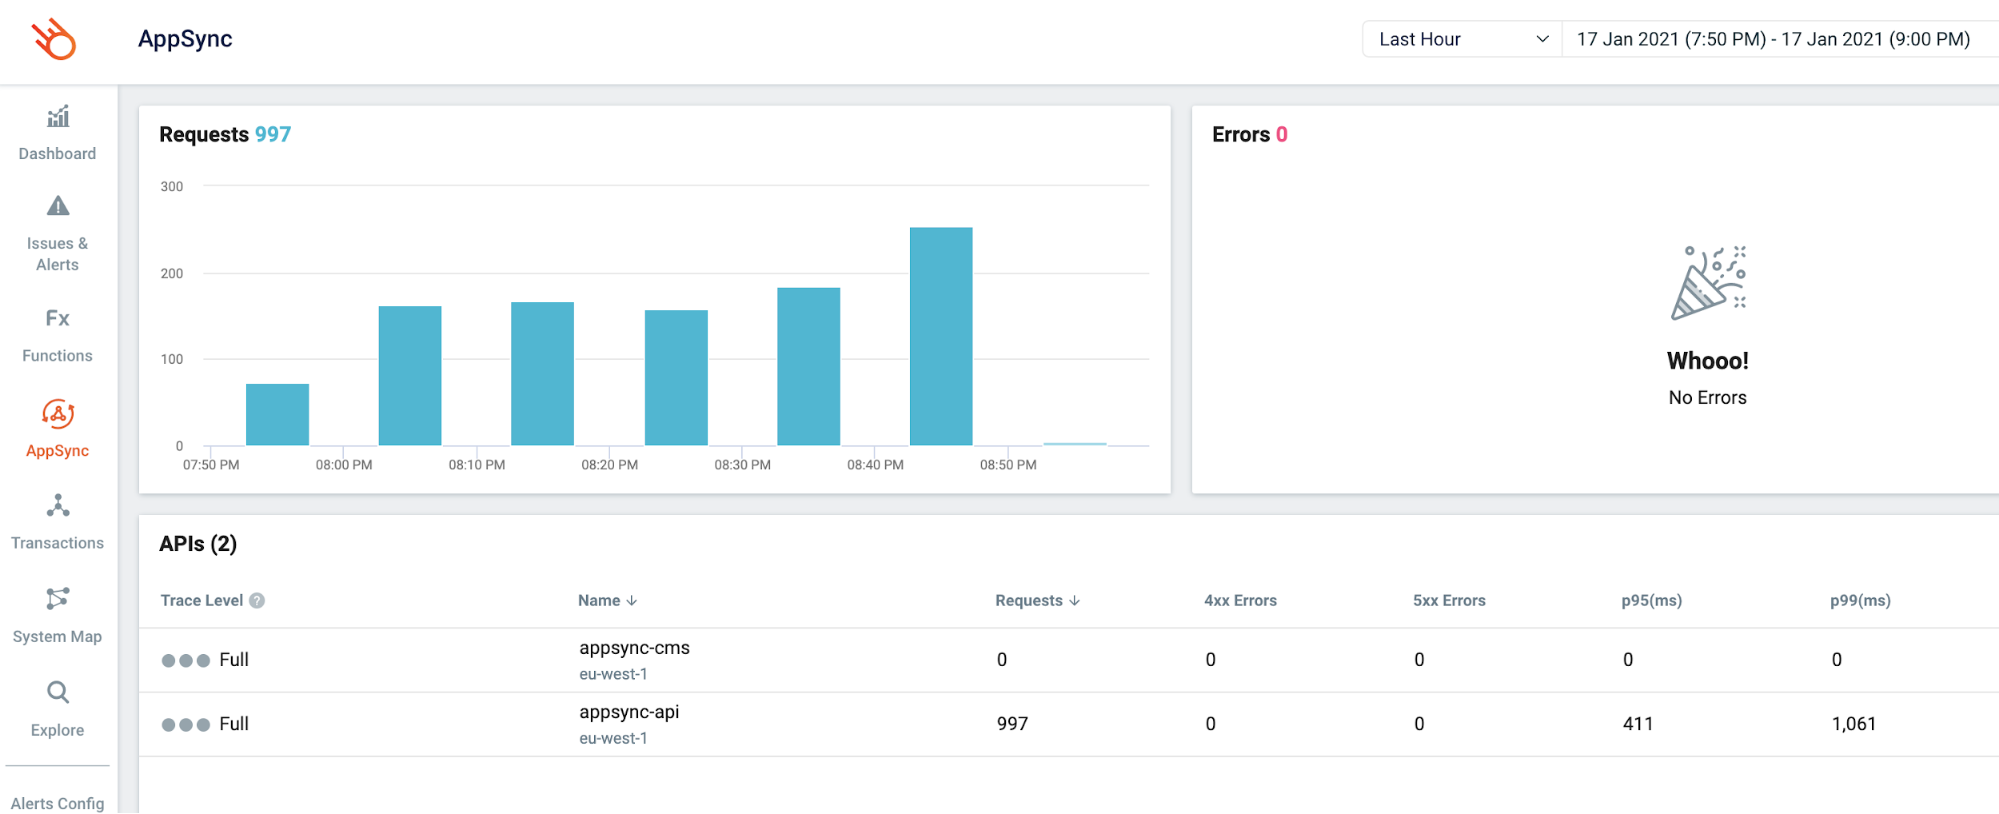
For example, I can see a high-level summary for my AppSync APIs here:
If I click on one of these APIs then it takes me to the “Explore” page where I can do a free text search against any of the data that Lumigo has ingested about my AppSync API.
For example, I can look for traces related to the top-level “search” query operation like this:
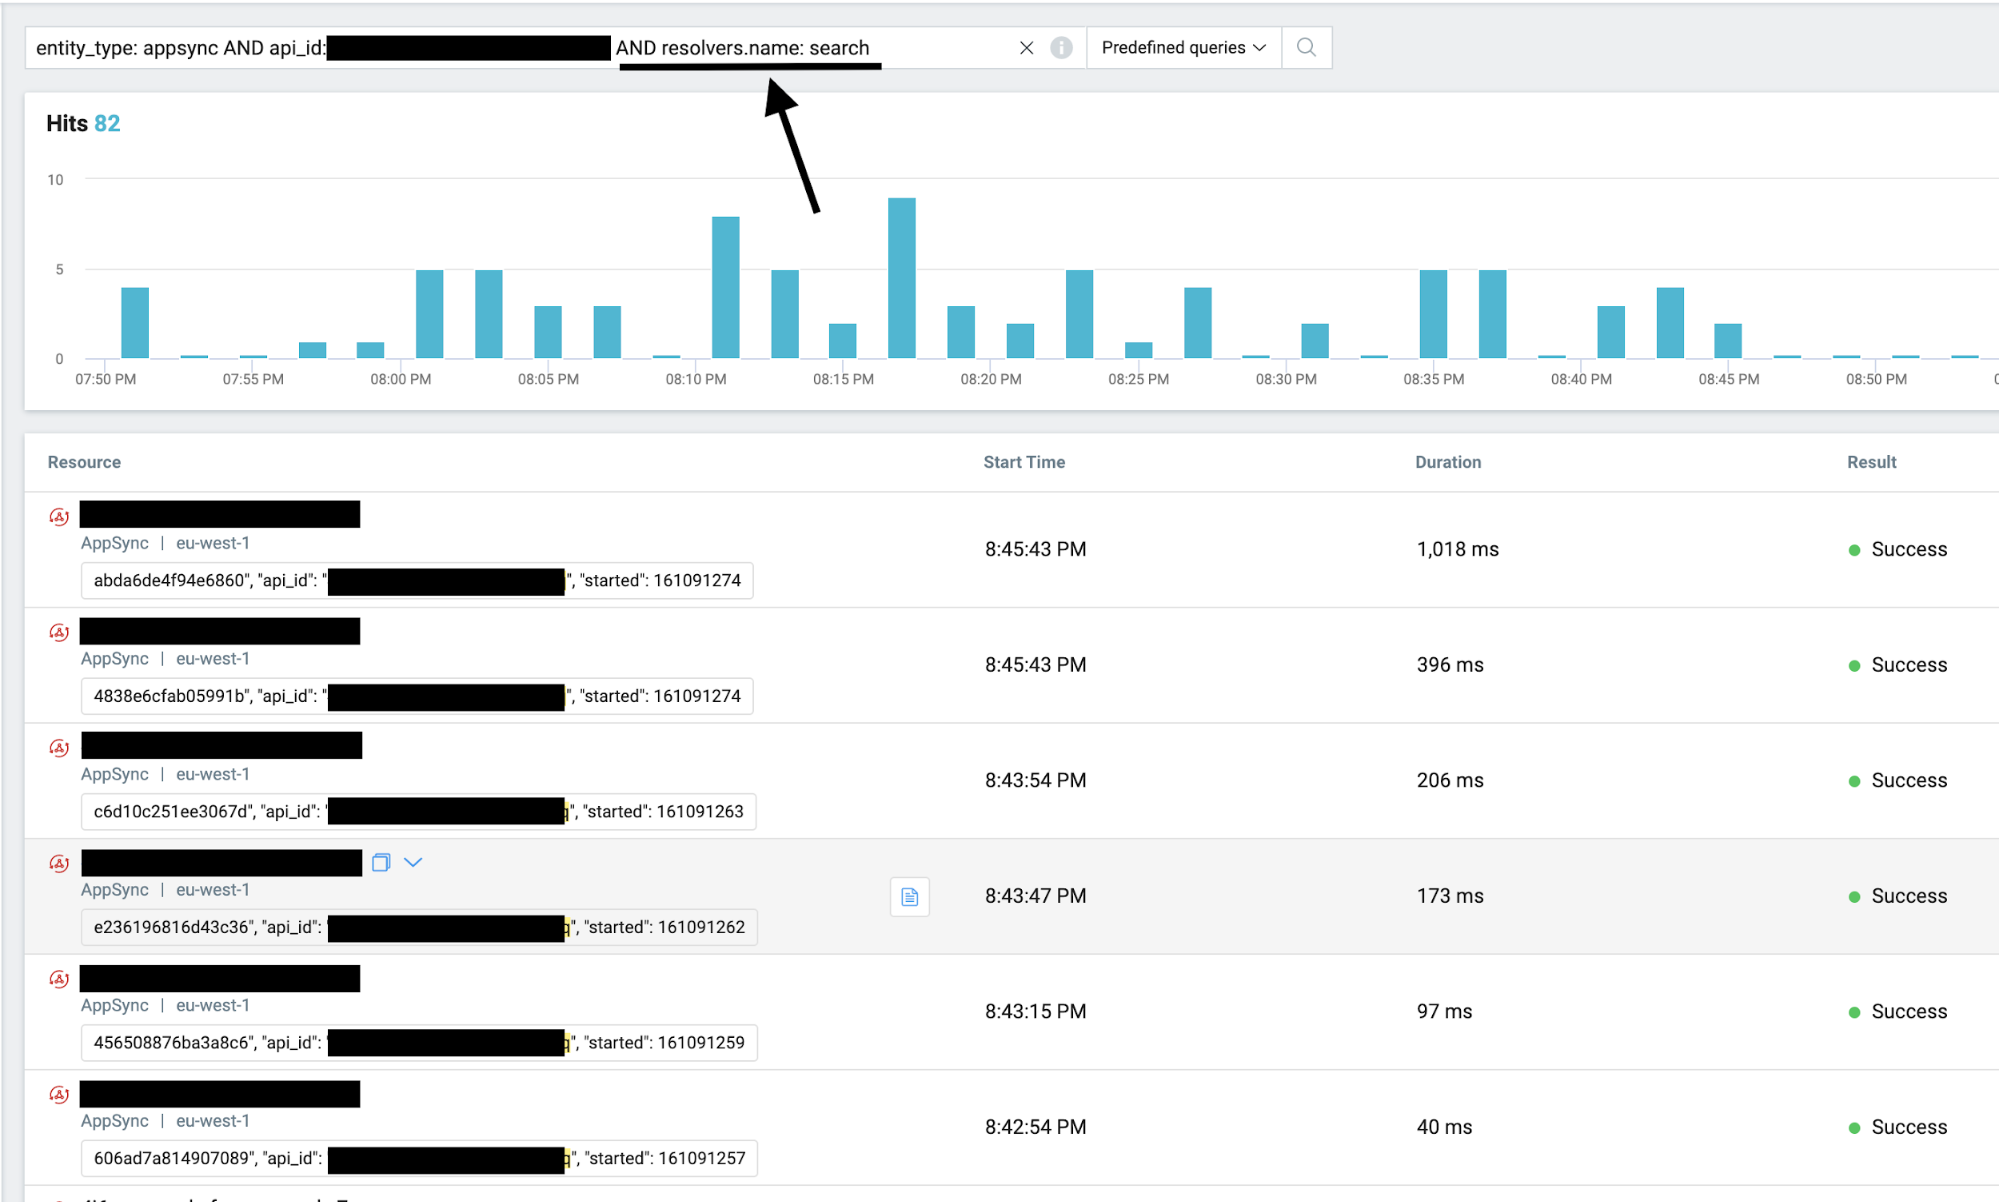
This makes it much easier for me to narrow down my search and find information on specific resolvers or even requests.
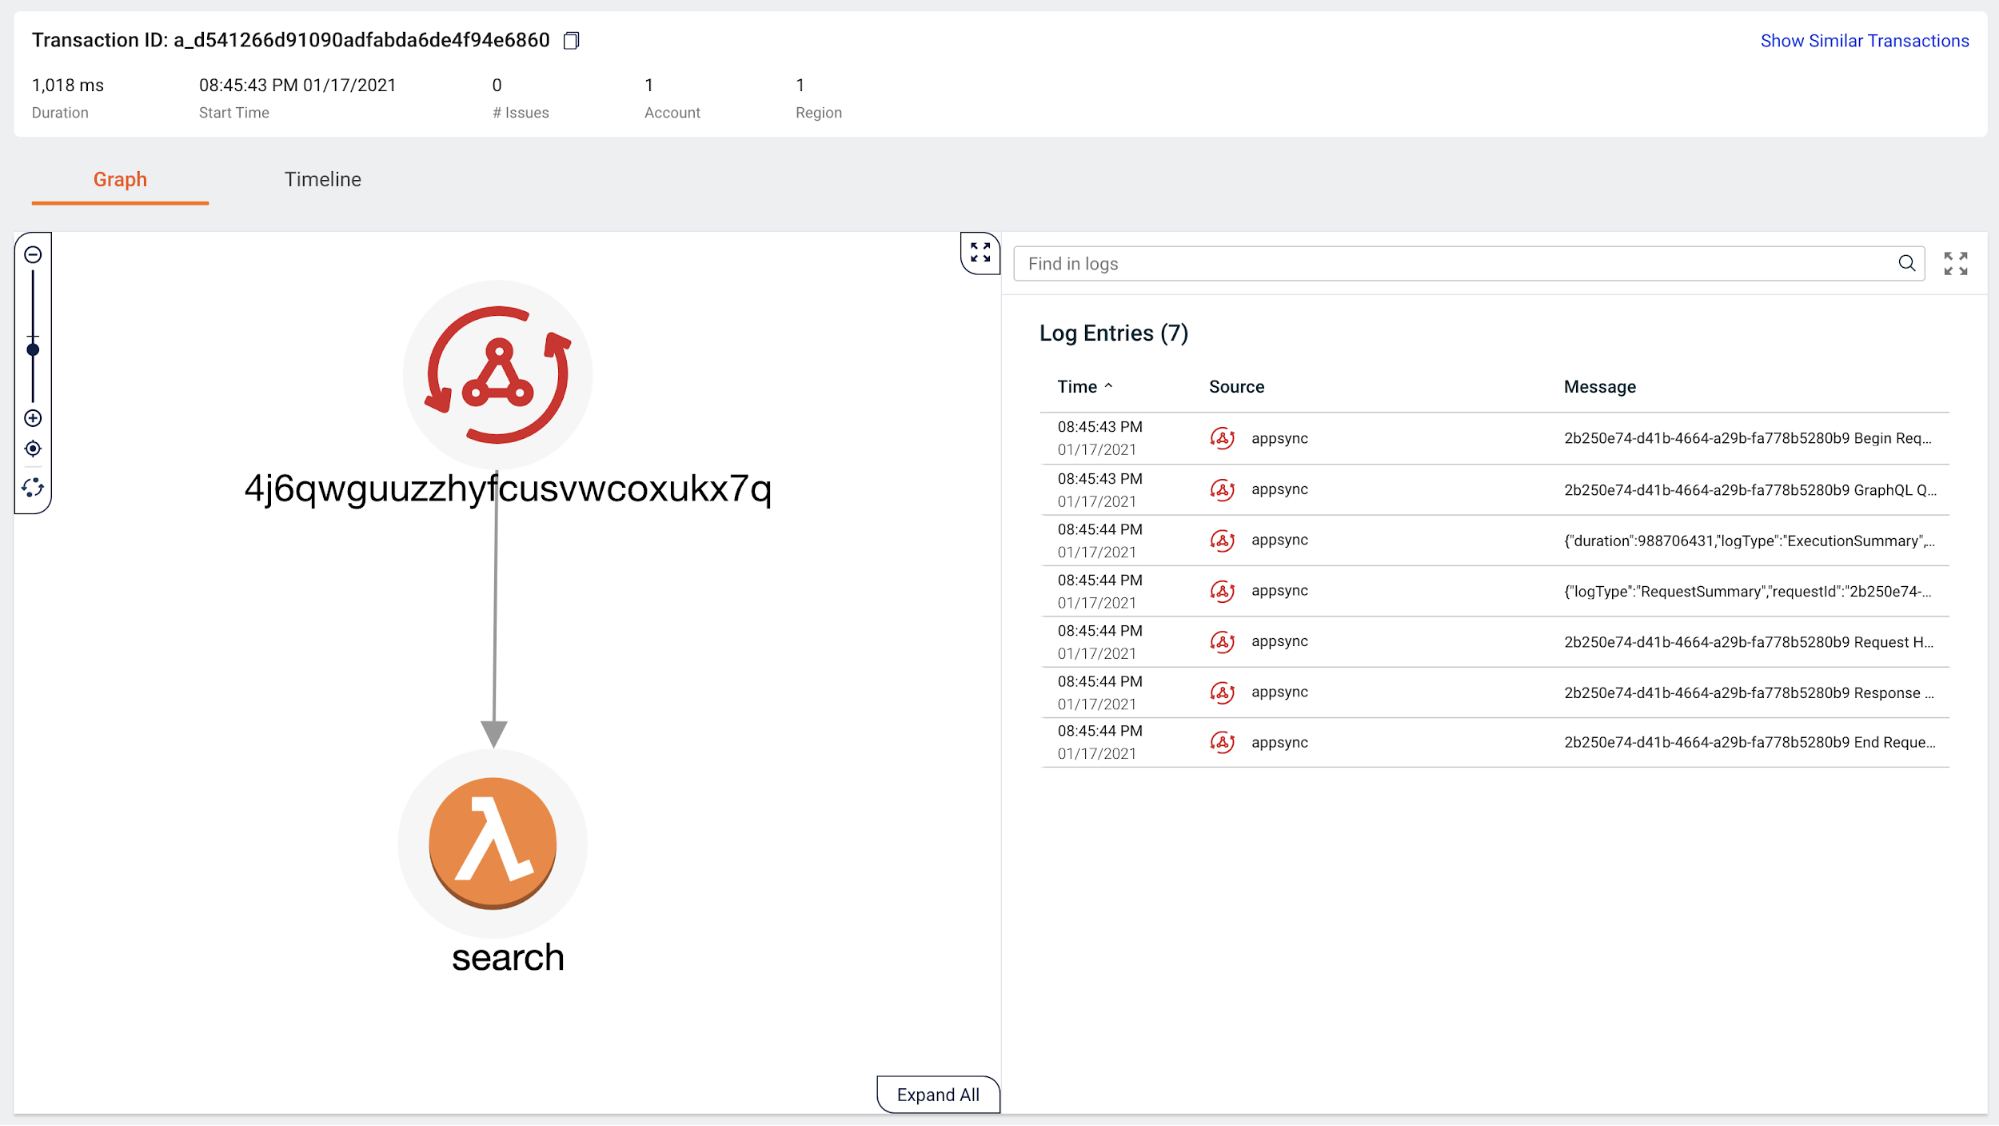
Clicking on one of these transactions takes me to the “Transactions” page where I can see the components that were involved, as well as the relevant logs in CloudWatch Logs (in the right-side panel).
If you want to see how Lumigo can help you troubleshoot problems in your serverless application, sign up for a free account today.
To learn more join our webinar
If you want to learn more about AppSync and why your next project should use AppSync instead of API Gateway, then join us for our free webinar next Thursday, 28th Jan.
We are going to cover topics such as:
- GraphQL vs REST
- AppSync vs API Gateway
- AppSync vs running GraphQL in Lambda
- Monitoring and debugging AppSync APIs