Aug 08 2019

AWS CloudWatch is a powerful tool, but it can be tricky to use it for monitoring your AWS Lambda functions. In this post we’ll help you:
- Understand how CloudWatch logs work for Lambda functions
- Understand CloudWatch pricing and implications for serverless apps
In the rest of the post we’ll cover several important CloudWatch features you can use to monitor your AWS Lambda functions more effectively:
- CloudWatch subscription filters – allow you to send serverless logs to Amazon Kinesis for better performance and easier management at scale
- CloudWatch metric filters – allow you to define useful custom metrics, such as the latency of a Lambda function
- CloudWatch Log Insights – lets you write SQL-like queries, generate stats from log messages, visualize results and output them to a dashboard.
Understanding CloudWatch Logs for AWS Lambda
Whenever our Lambda function writes to stdout or stderr, the message is collected asynchronously without adding to our function’s execution time. They are then shipped to AWS CloudWatch Logs and organized into log groups.
Every function has a matching log group with the same name, following the /aws/lambda prefix:

Inside each log group, there are log streams – each maps to concurrent execution of the function. Each concurrent execution would write to its own log stream in parallel.
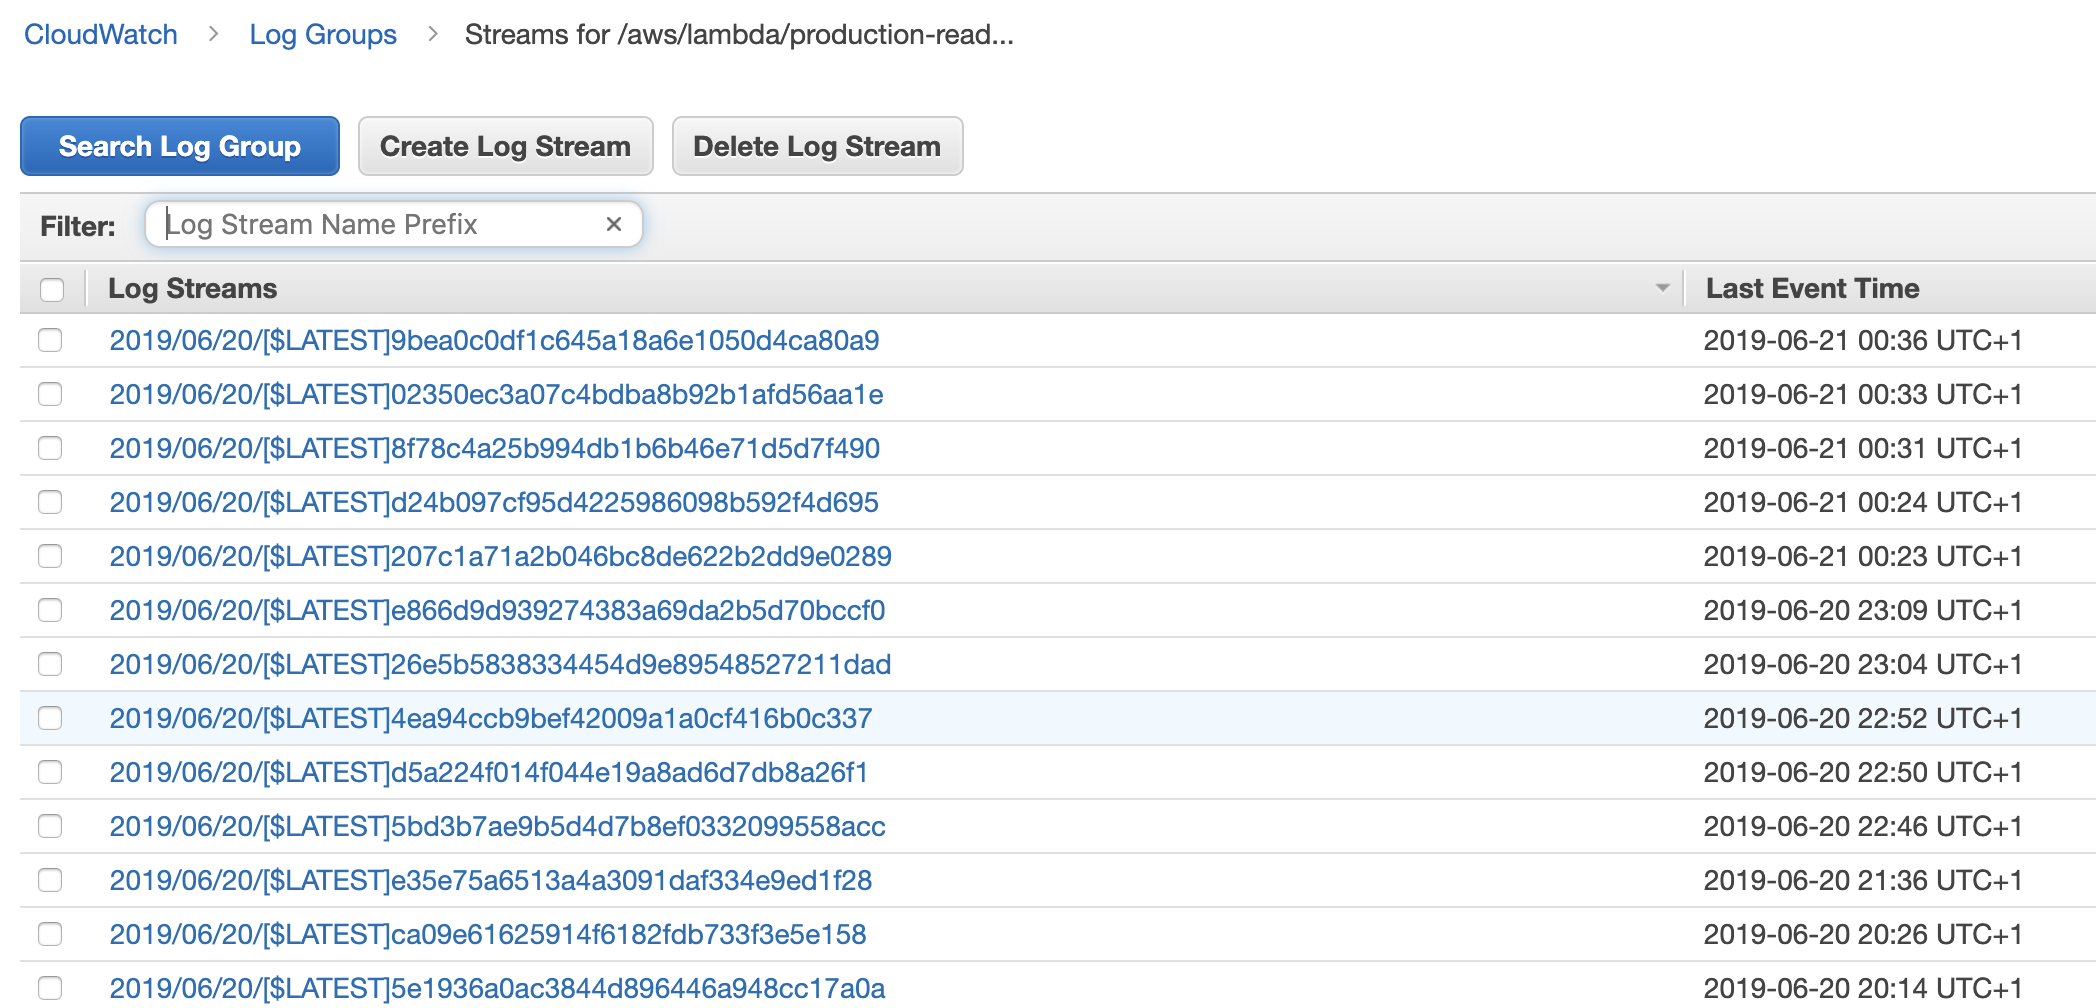
It’s worth mentioning that we can also easily ship logs from ECS tasks as well as API Gateway to CloudWatch Logs as well. For services such as Kinesis Firehose, it also has built-in support for sending service logs to CloudWatch Logs too.
CloudWatch Logs Pricing
In terms of pricing, CloudWatch Logs charges for both ingestion as well as storage.
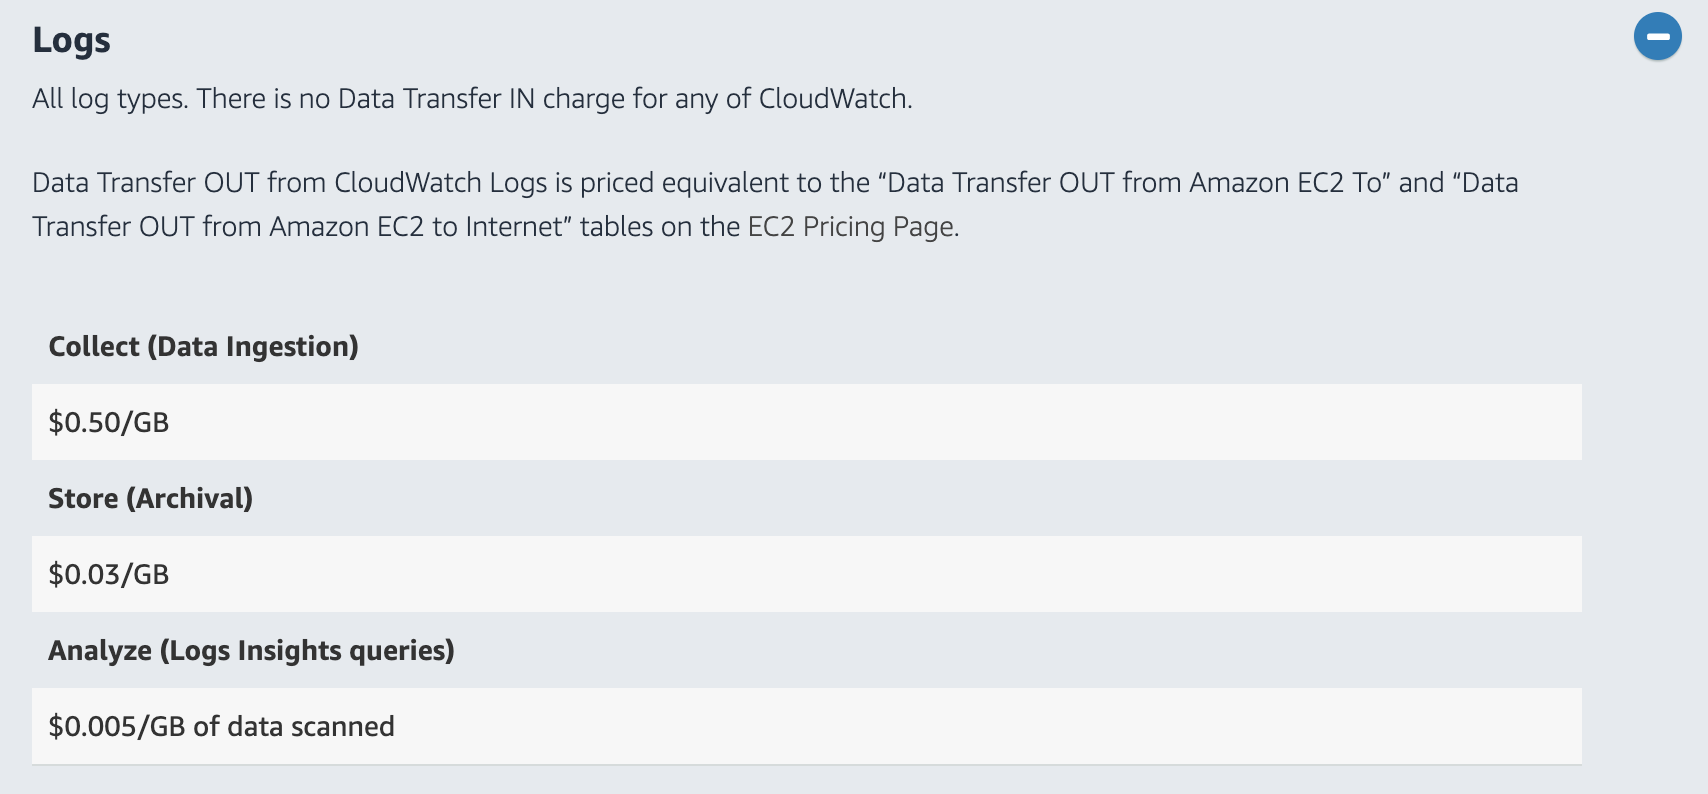
At $0.50 per GB ingestion and $0.03 per GB per month for storage, AWS CloudWatch Logs is significantly cheaper than most of its competitors. The system also auto-scales based on traffic, is highly resilient and can store data for practically as long as we want.
Limitations
The big limitation of CloudWatch Logs is its inability to query logs across multiple log groups, although CloudWatch Logs Insights addresses this limitation somewhat by letting you query multiple log groups at the same time.
However, most people would forward their logs from AWS CloudWatch Logs to a managed ELK (Elasticsearch, Logstash, Kibana) stack. We’ll show you how to do that a bit later in this post with subscription filters.
Using CloudWatch Subscription Filters to Stream AWS Lambda Logs
A subscription filter lets us stream the log events to a destination within AWS. The supported destinations are:
- Kinesis stream
- Kinesis Firehose delivery stream
- A Lambda function
Despite being called “Subscription filters” in the AWS CloudWatch Logs console, currently there can only be one filter per log group. So choose wisely!
Which Destination Should You Use for Subscription Filters?
When we’re not running hundreds of concurrent Lambda executions, then it’s easiest to send our logs to a Lambda function.
However, as our scale increases, we need to concern ourselves with the number of concurrent Lambda executions. Since CloudWatch Logs is itself an async event source for Lambda, we don’t have much control over its concurrency. It’s possible for our log-shipping function to consume too much concurrency and cause business-critical functions to be throttled. We can put a concurrency limit on the log-shipping function, but that puts us at risk of losing logs. A much better solution (when running at scale) is to send the logs to Kinesis or Kinesis Firehose instead.
Kinesis Firehose supports a number of predefined destinations: Amazon S3, Amazon Redshift, Amazon Elasticsearch Service, and Splunk. We don’t need to write any custom code, just point the delivery stream at the destination and we’re done! We can also use Lambda to enrich and transform the data first too. However, we’re limited to those few destinations.
Kinesis, on the other hand, offers us more flexibility. We can process data with multiple Lambda functions. One to ship logs to our ELK stack, and another for some other purpose. And, we can still forward the events to a Kinesis Firehose delivery stream, again, without having to write any custom code.
Fortunately, whichever destination we choose, we have open-sourced some tools to make it easy to apply them to all our Lambda logs.
Using CloudWatch Metric Filters to Gather AWS Lambda Metrics
One of the most underappreciated features of CloudWatch Logs is the ability to turn logs into metrics and alerts with metric filters.
To create a new metric filter, select the log group, and click “Create Metric Filter”.
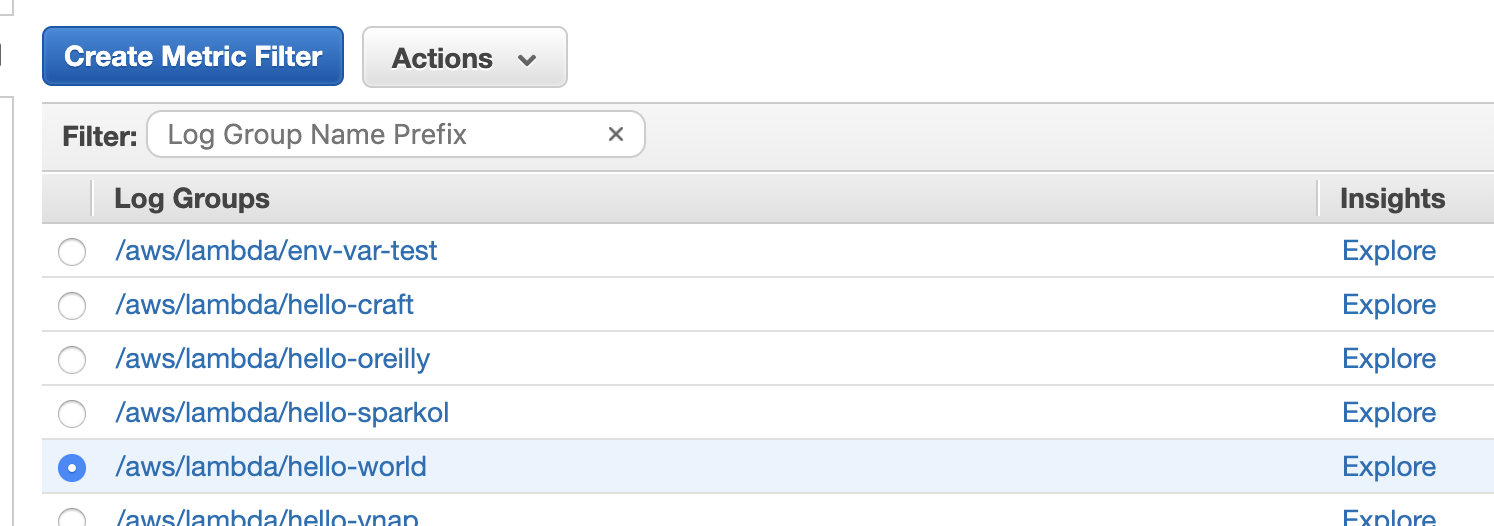
Then we need to set a filter pattern to select the relevant log messages. For more details on the query syntax, see this page.
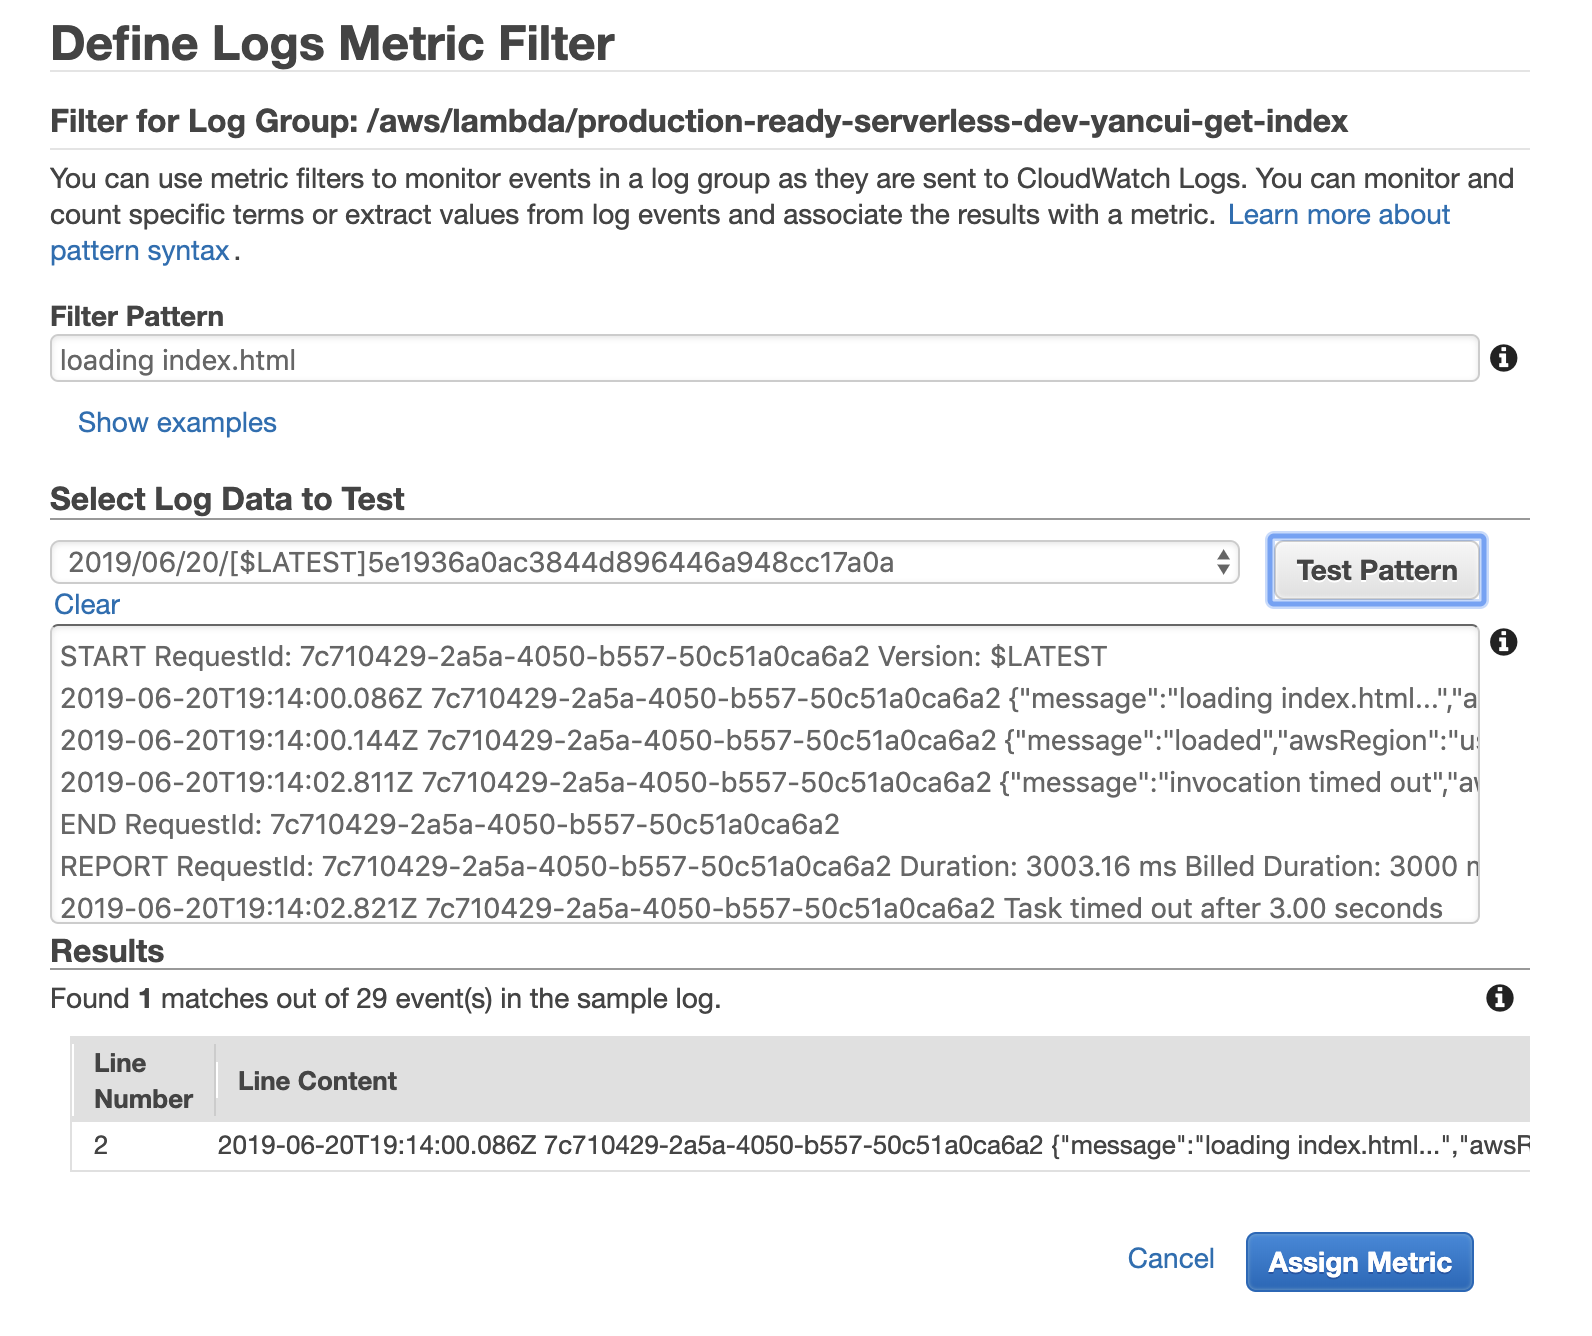
After targeting the right log messages, we need to turn them into metrics. On the following screen, we can configure that conversion.
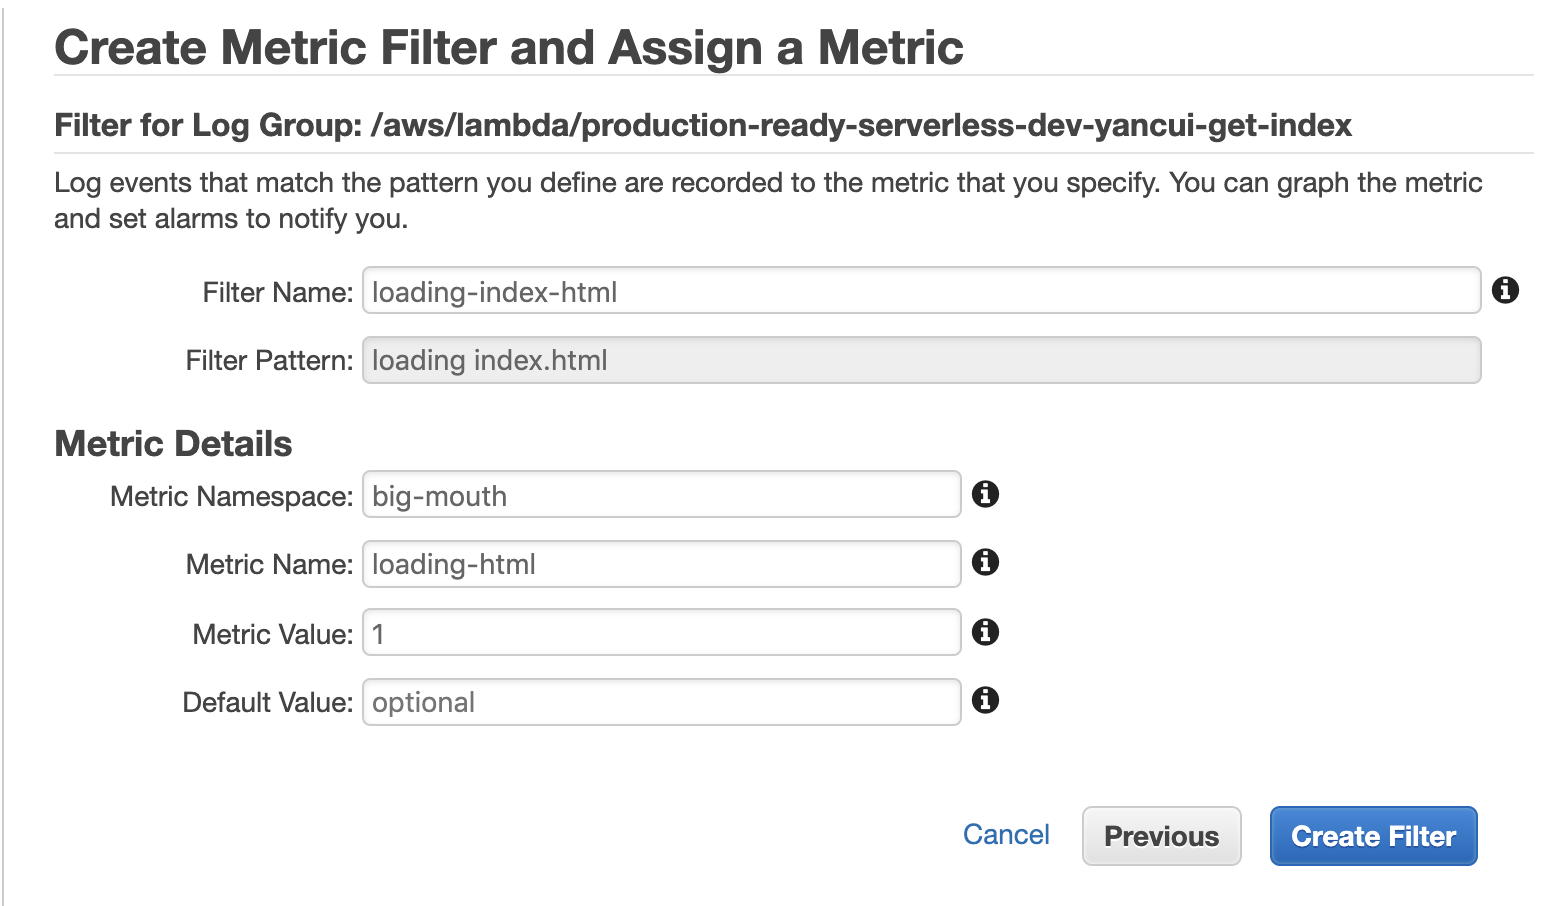
If we use a Metric Value of 1 then the metric is essentially a count of the number of matched log messages. This is all we need for many use cases such as counting the number of errors. But what if we want to collect custom latency metrics?
To capture latency values, we need to apply a pattern that captures different parts of the log message. The following example, for instance, captures the latency value and unit in named variables.
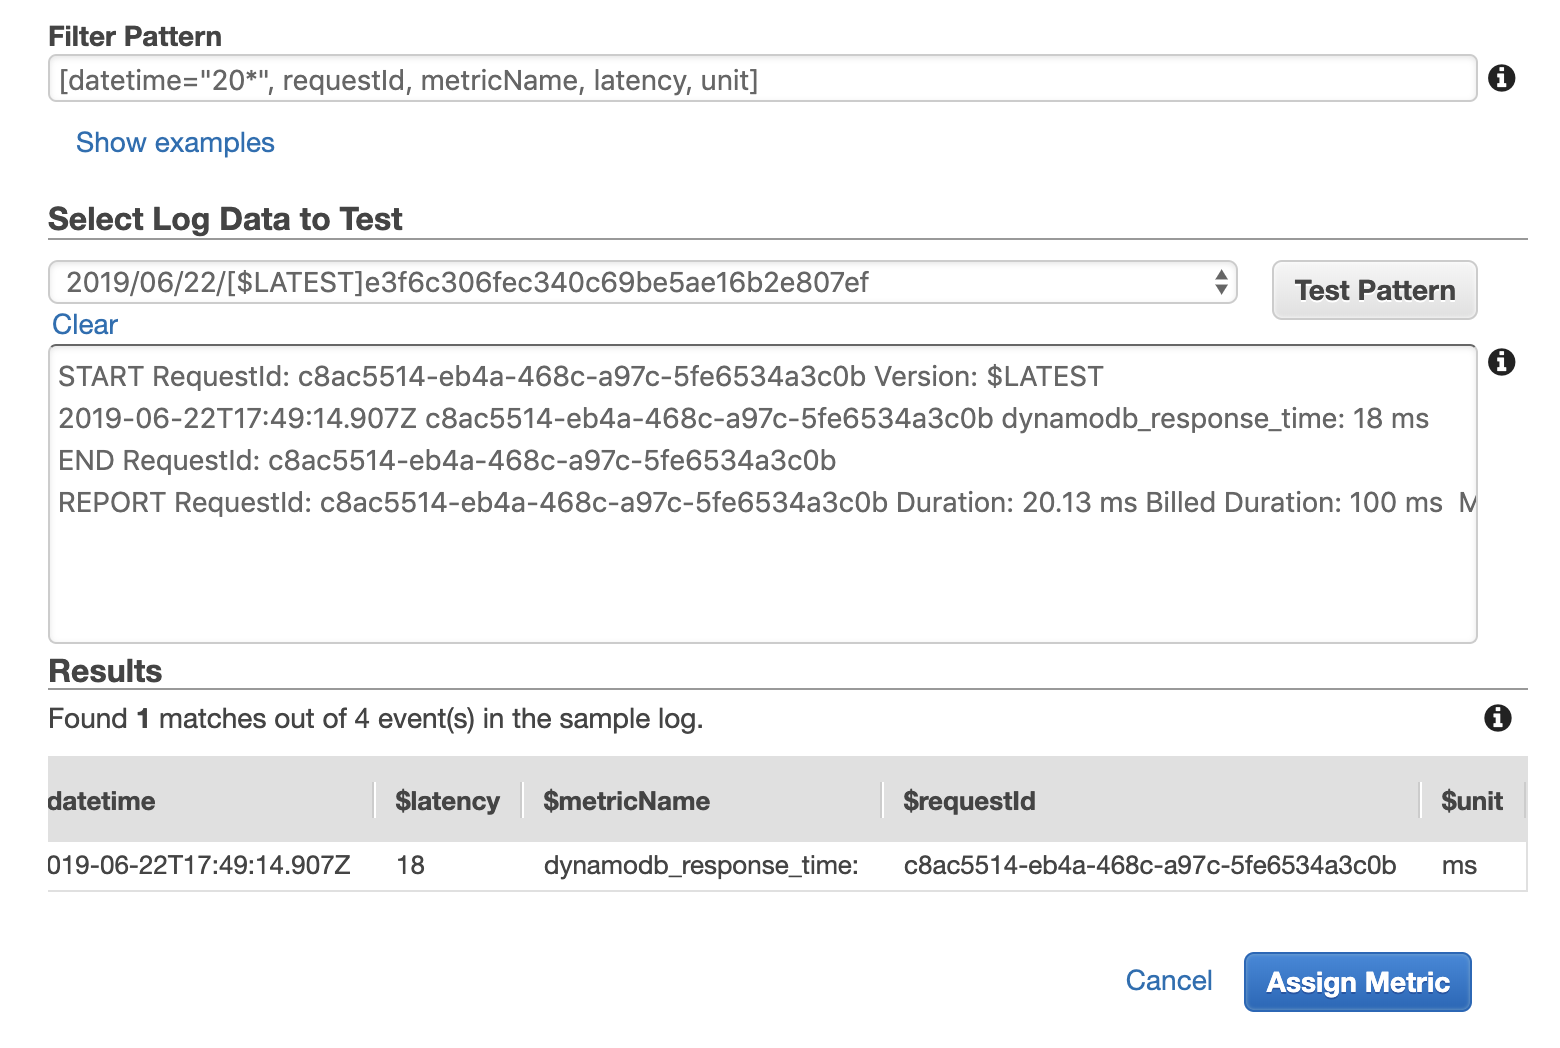
We can then reference these named variables when we define the metric.
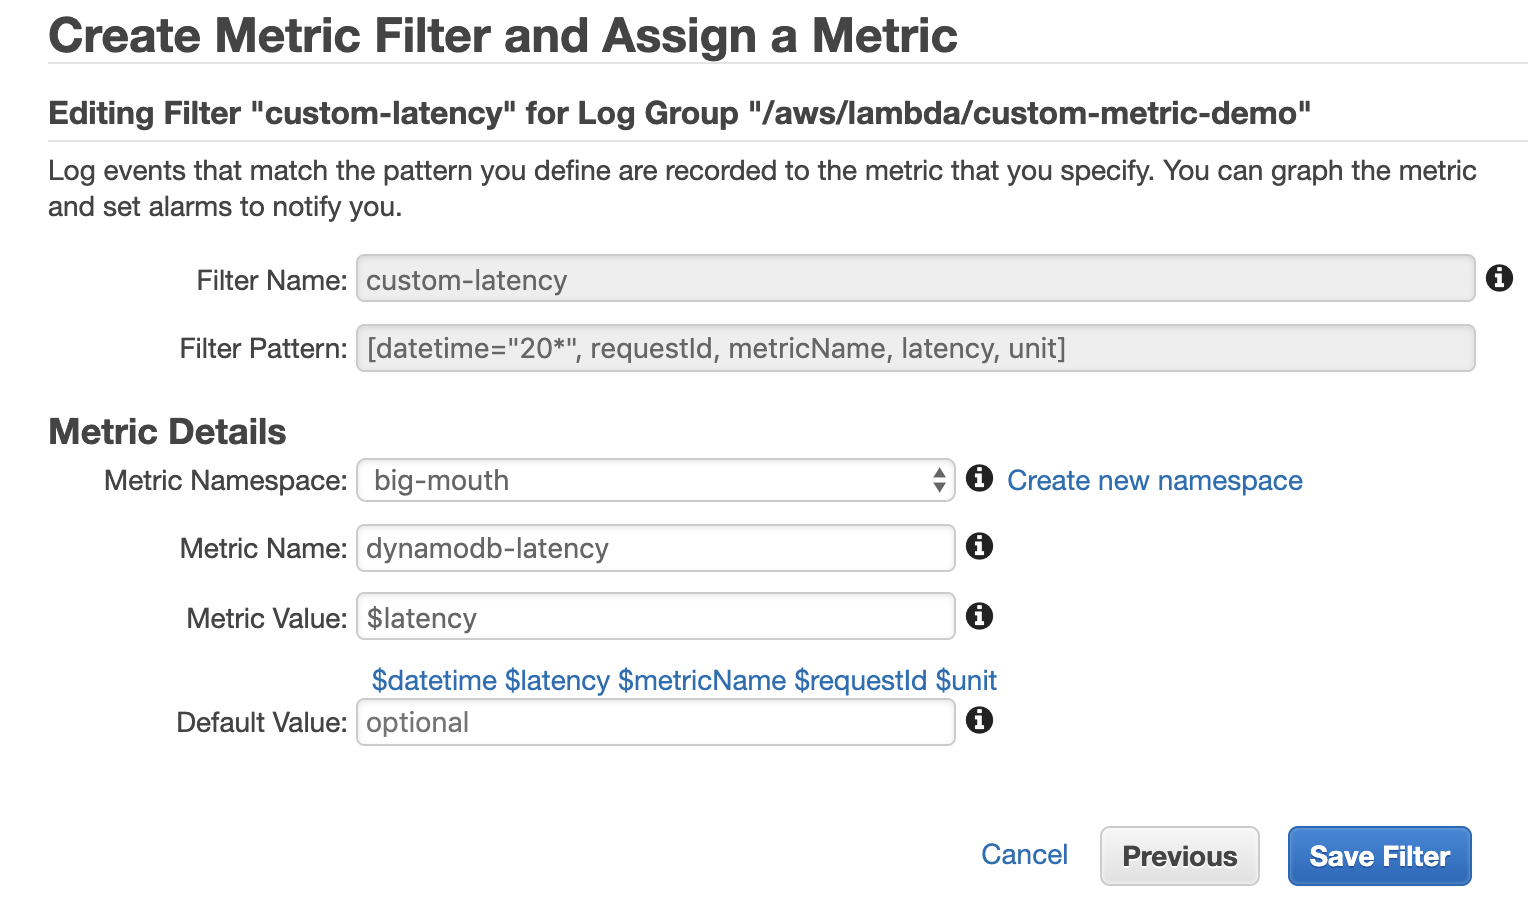
Once the metric filter is created, we can see the custom metric in the CloudWatch Metrics console.

Limitations
While you can parameterize the metric value using name fields, you can’t parameterize the metric name. This means you need to create a metric filter for every custom metric you intend to log from the function. As our application logic evolves, and we need to record more custom metrics, it becomes something that’s easy to forget. Also, there is a hard limit of 100 metric filters per log group.
Using CloudWatch Logs Insights to Create a Monitoring Dashboard for AWS Lambda
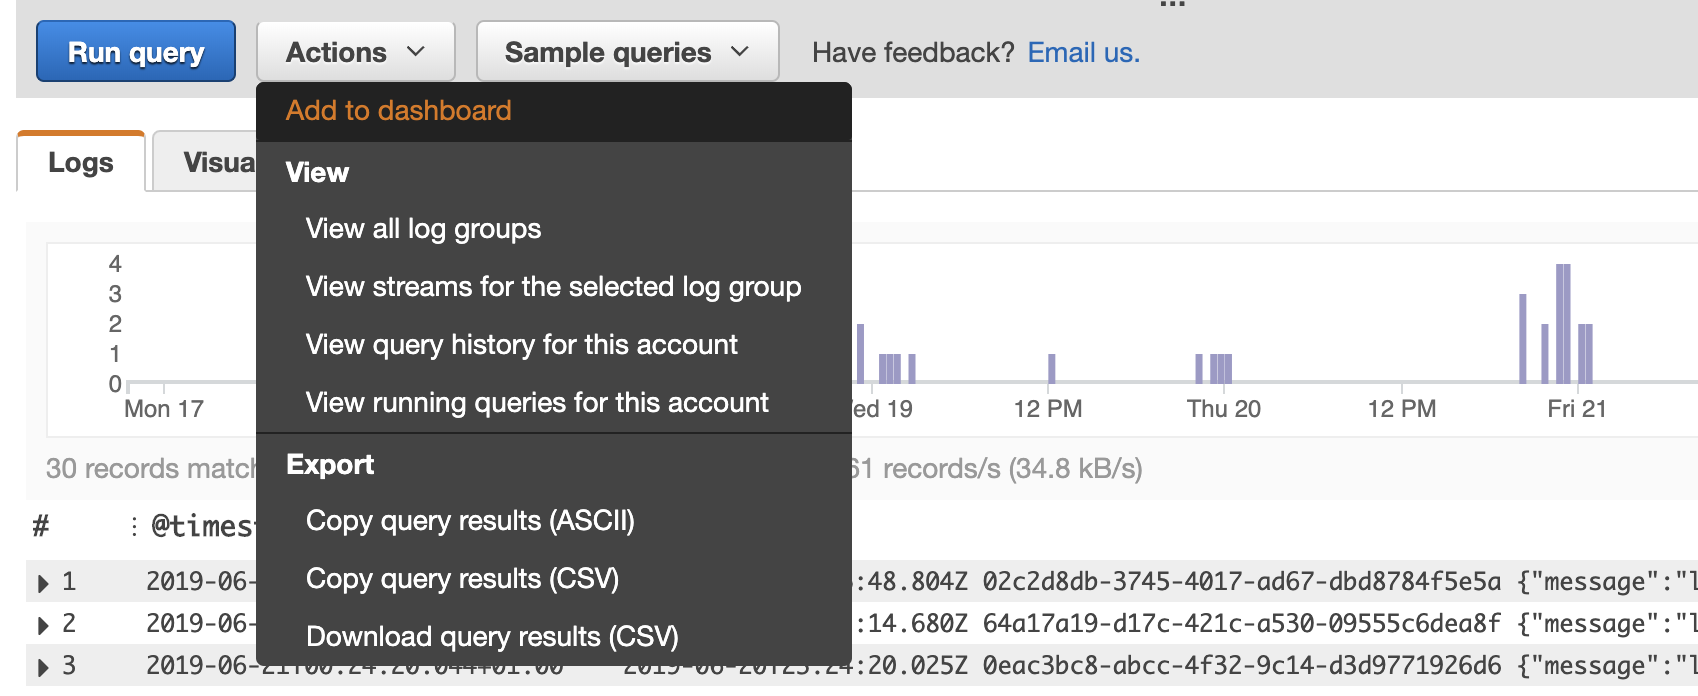
CloudWatch Logs’ built-in query capability is severely limited. CloudWatch Logs Insights gives you the ability to write SQL-esque queries, and to sort and even generate stats from matched log messages.
You can also visualize the search results in the console, and even output the results to a CloudWatch Metrics dashboard.
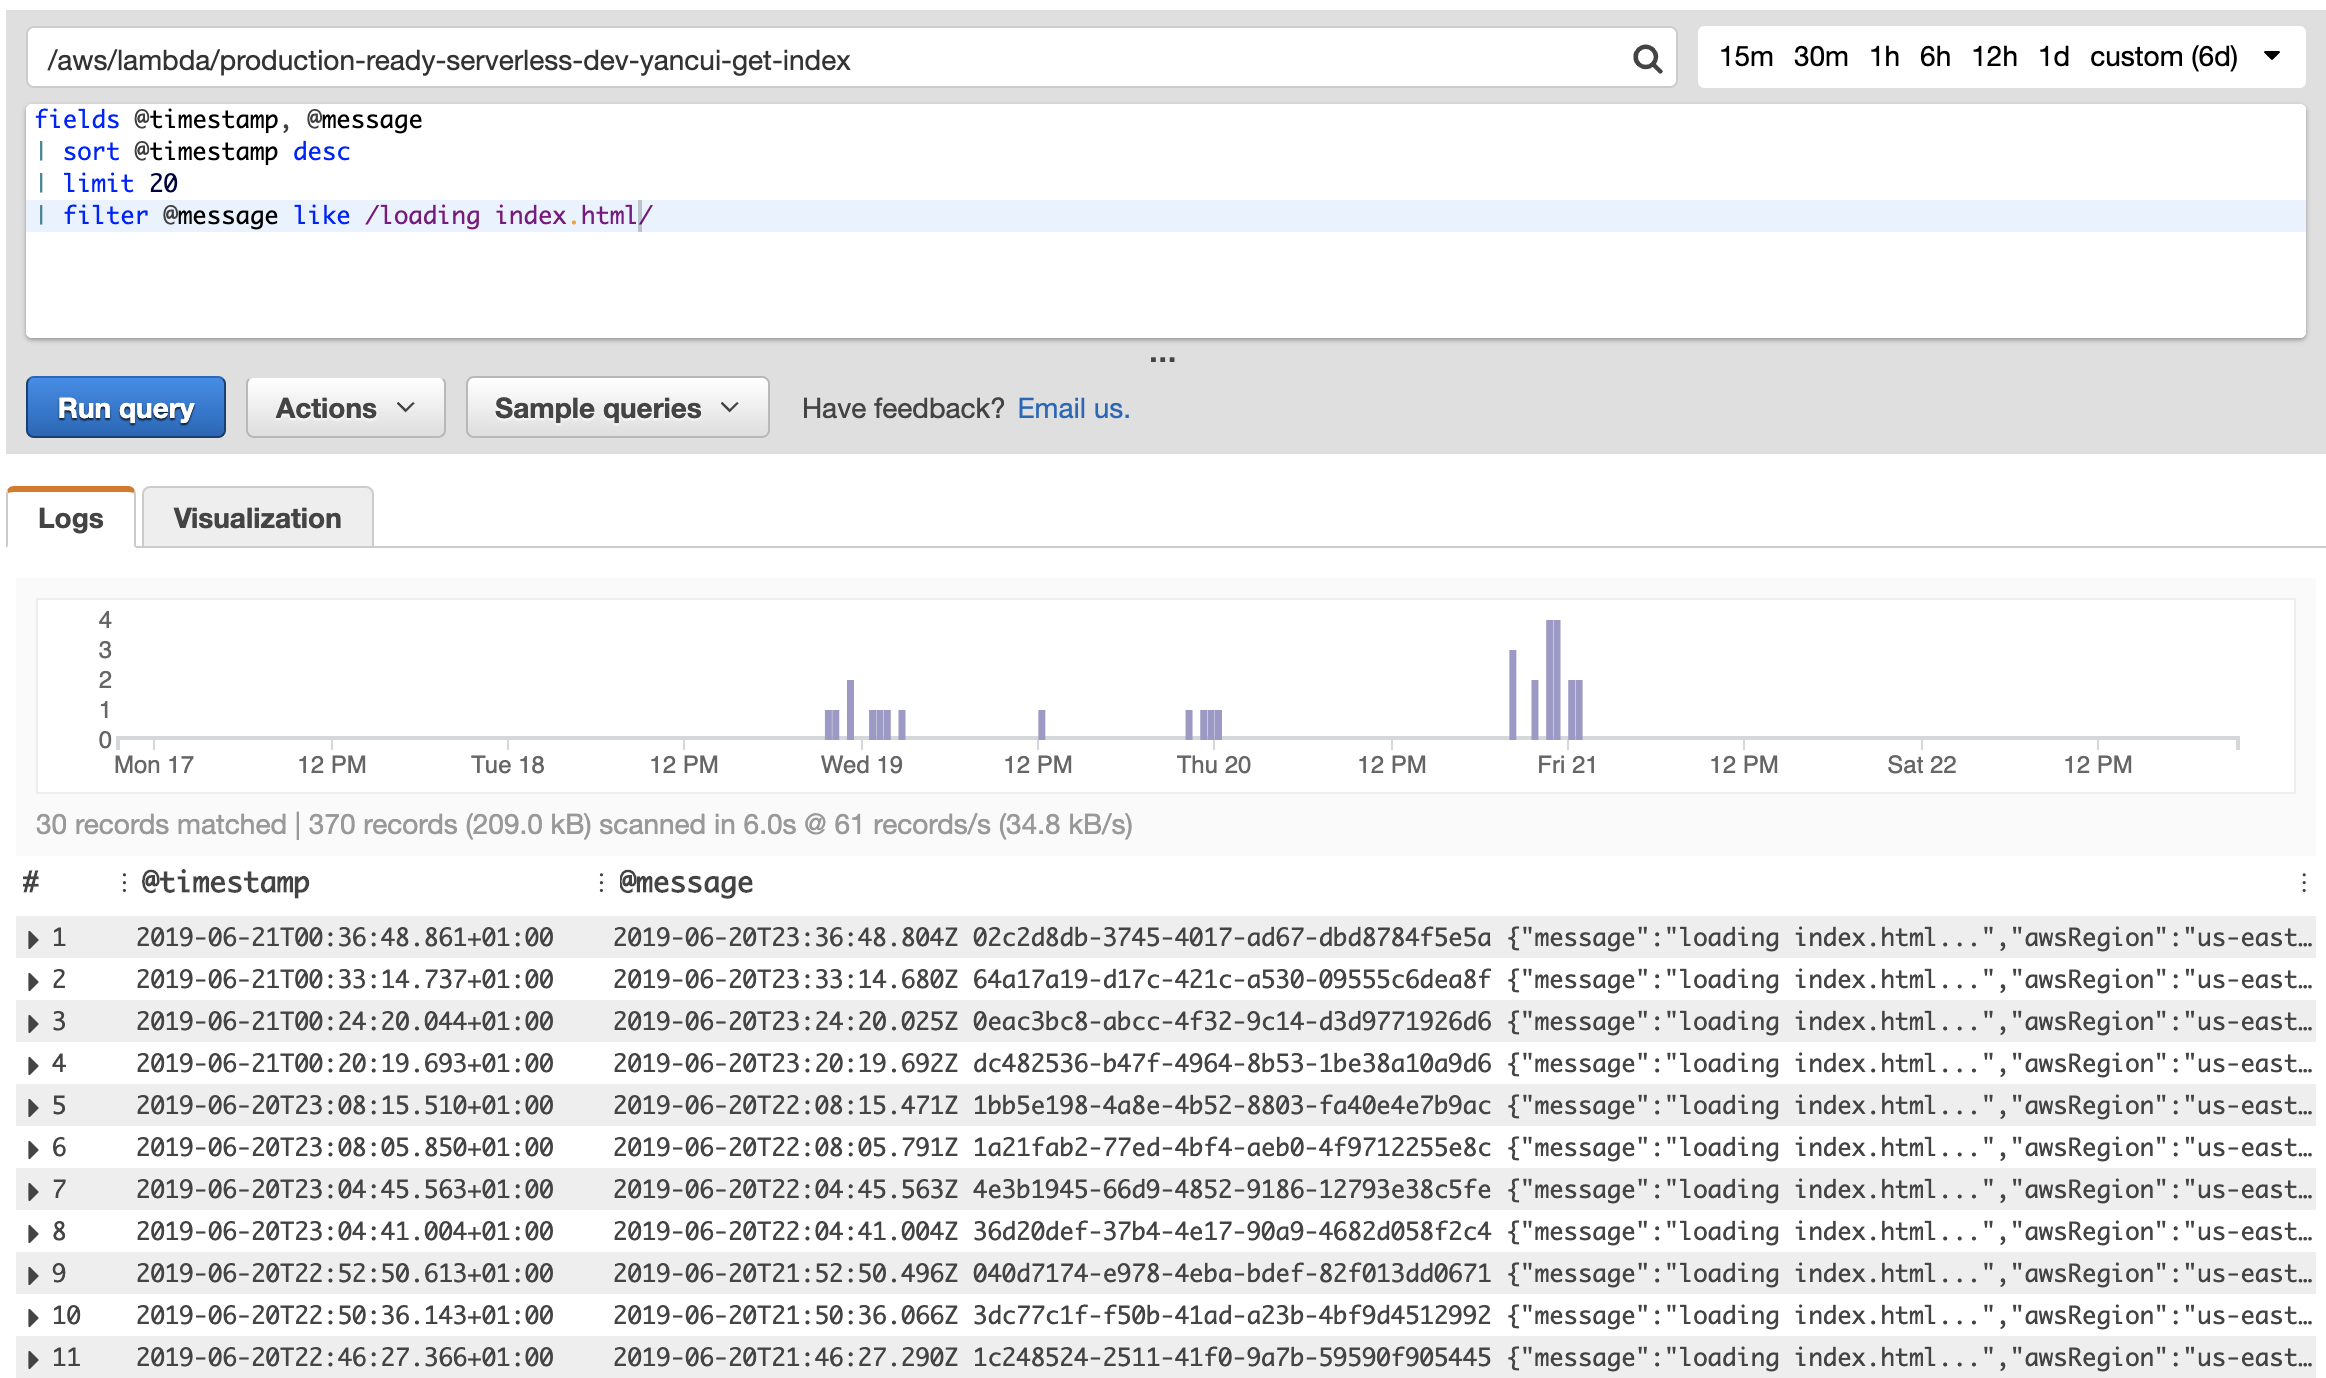
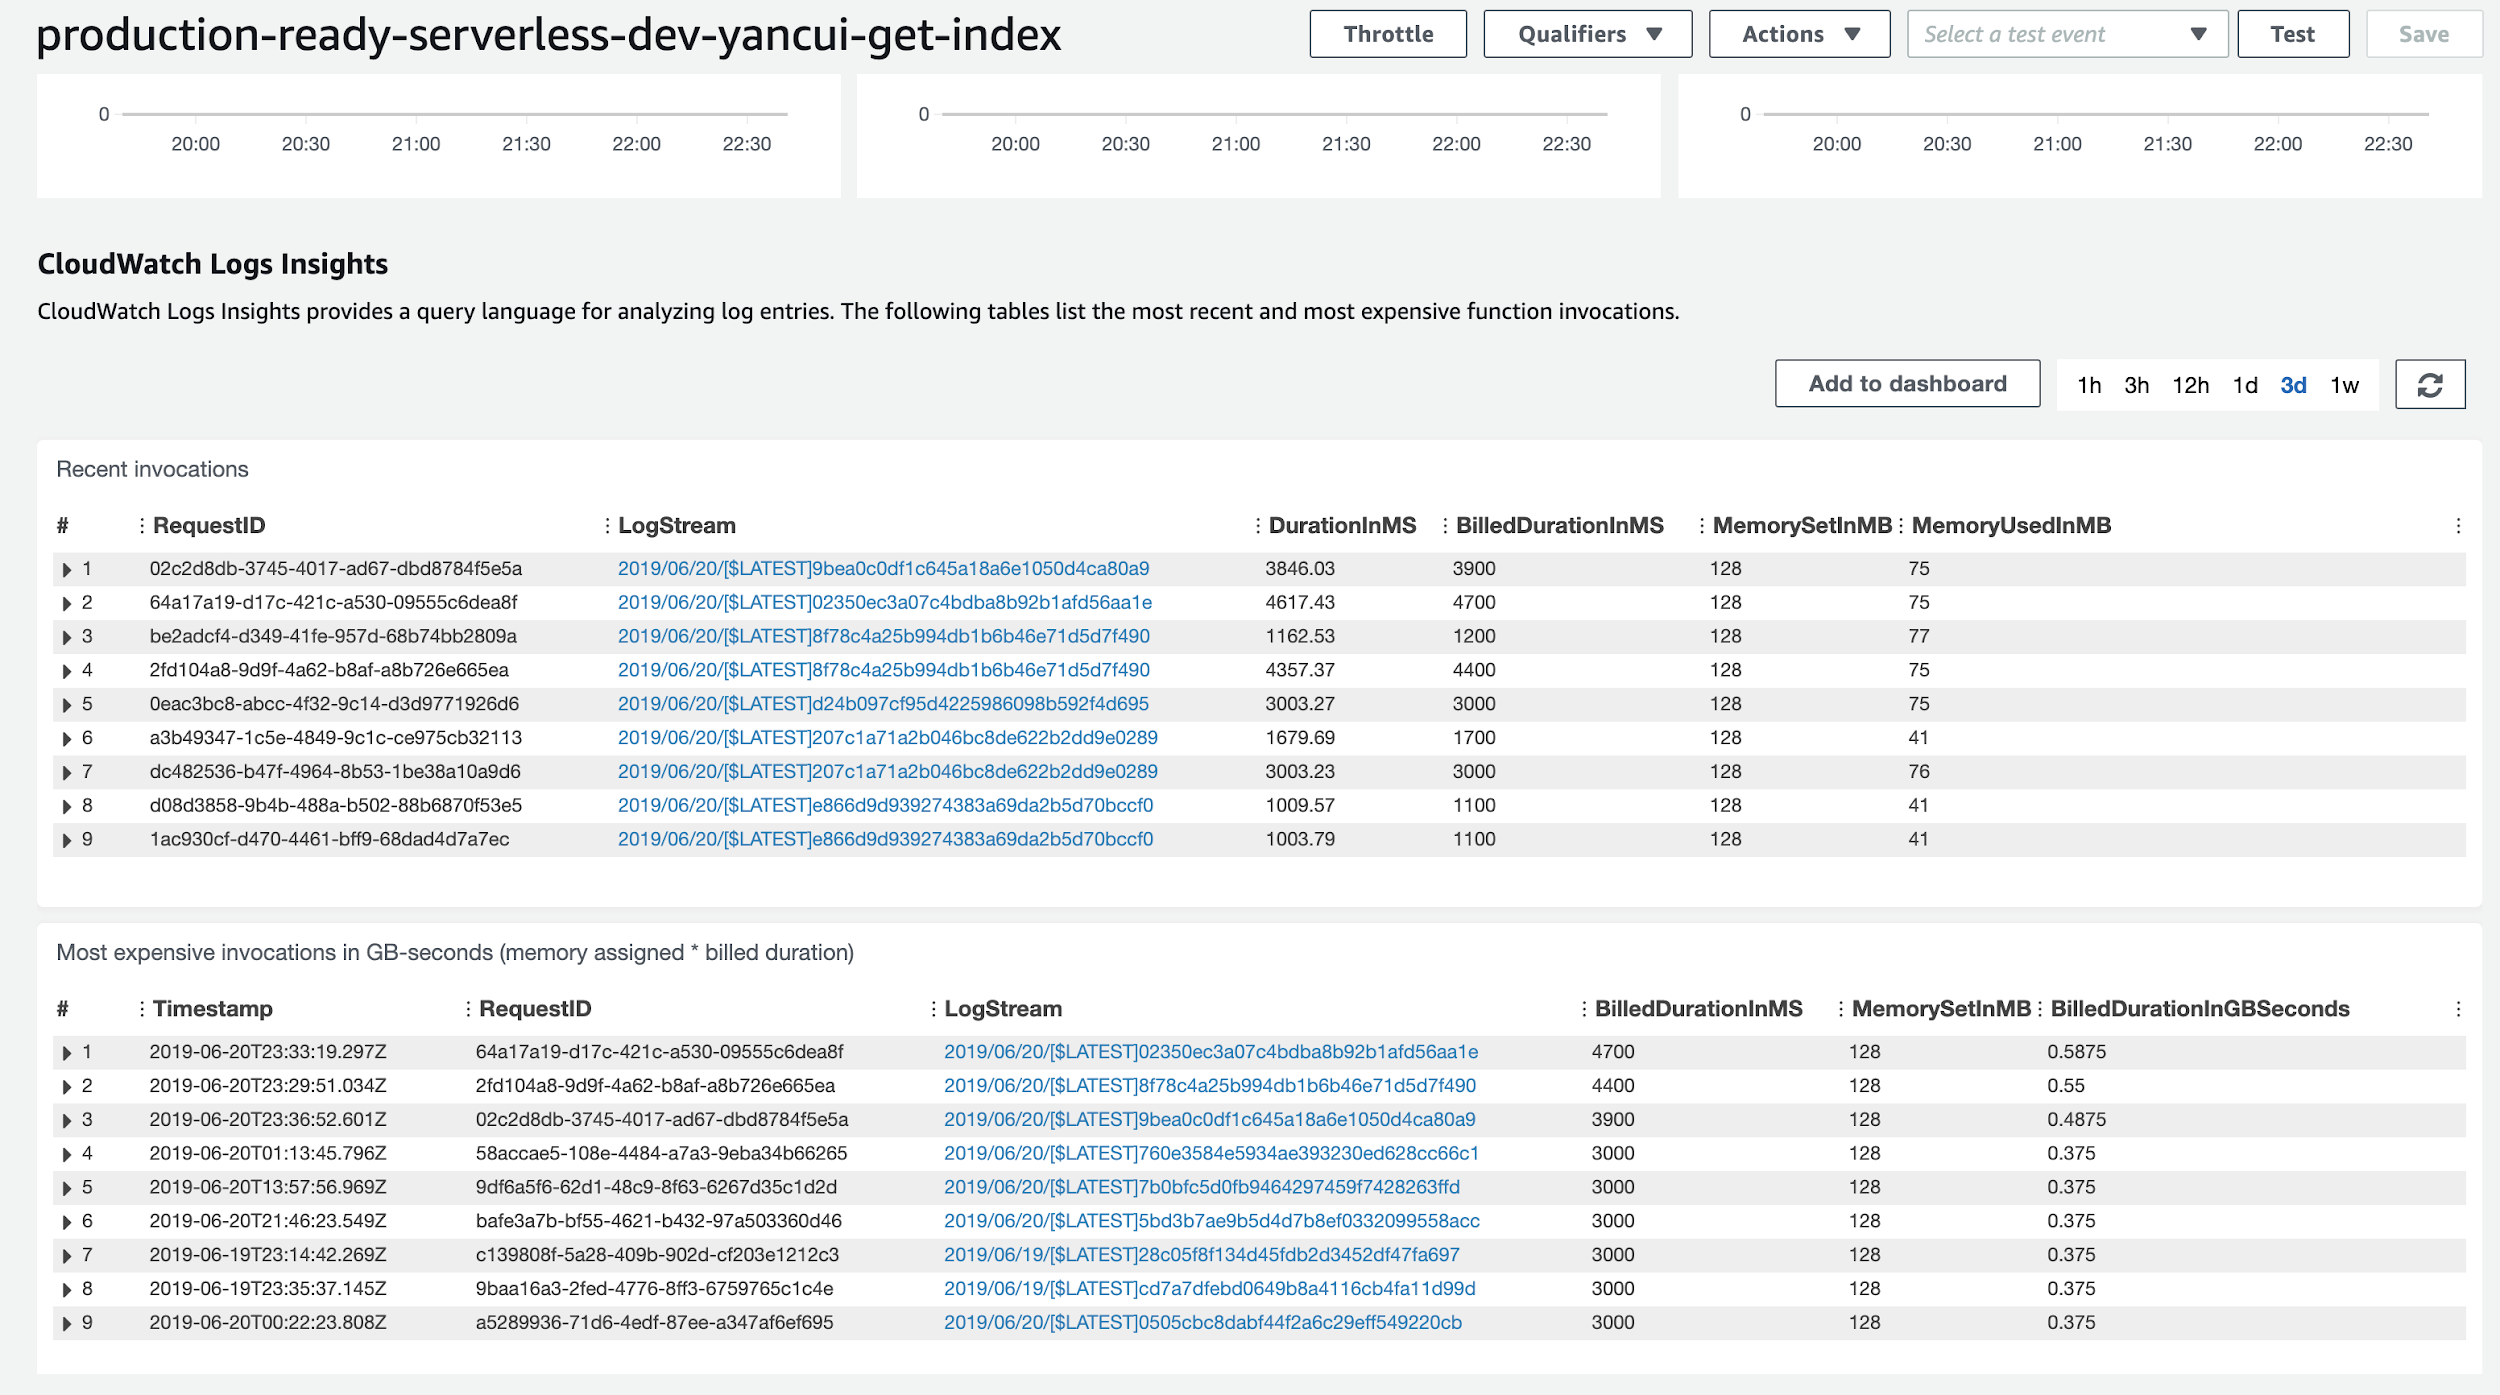
Recently, AWS has even integrated basic insights about our Lambda functions directly into the Lambda management console. Now, we can see summaries of the most recent invocations and the most expensive invocations.
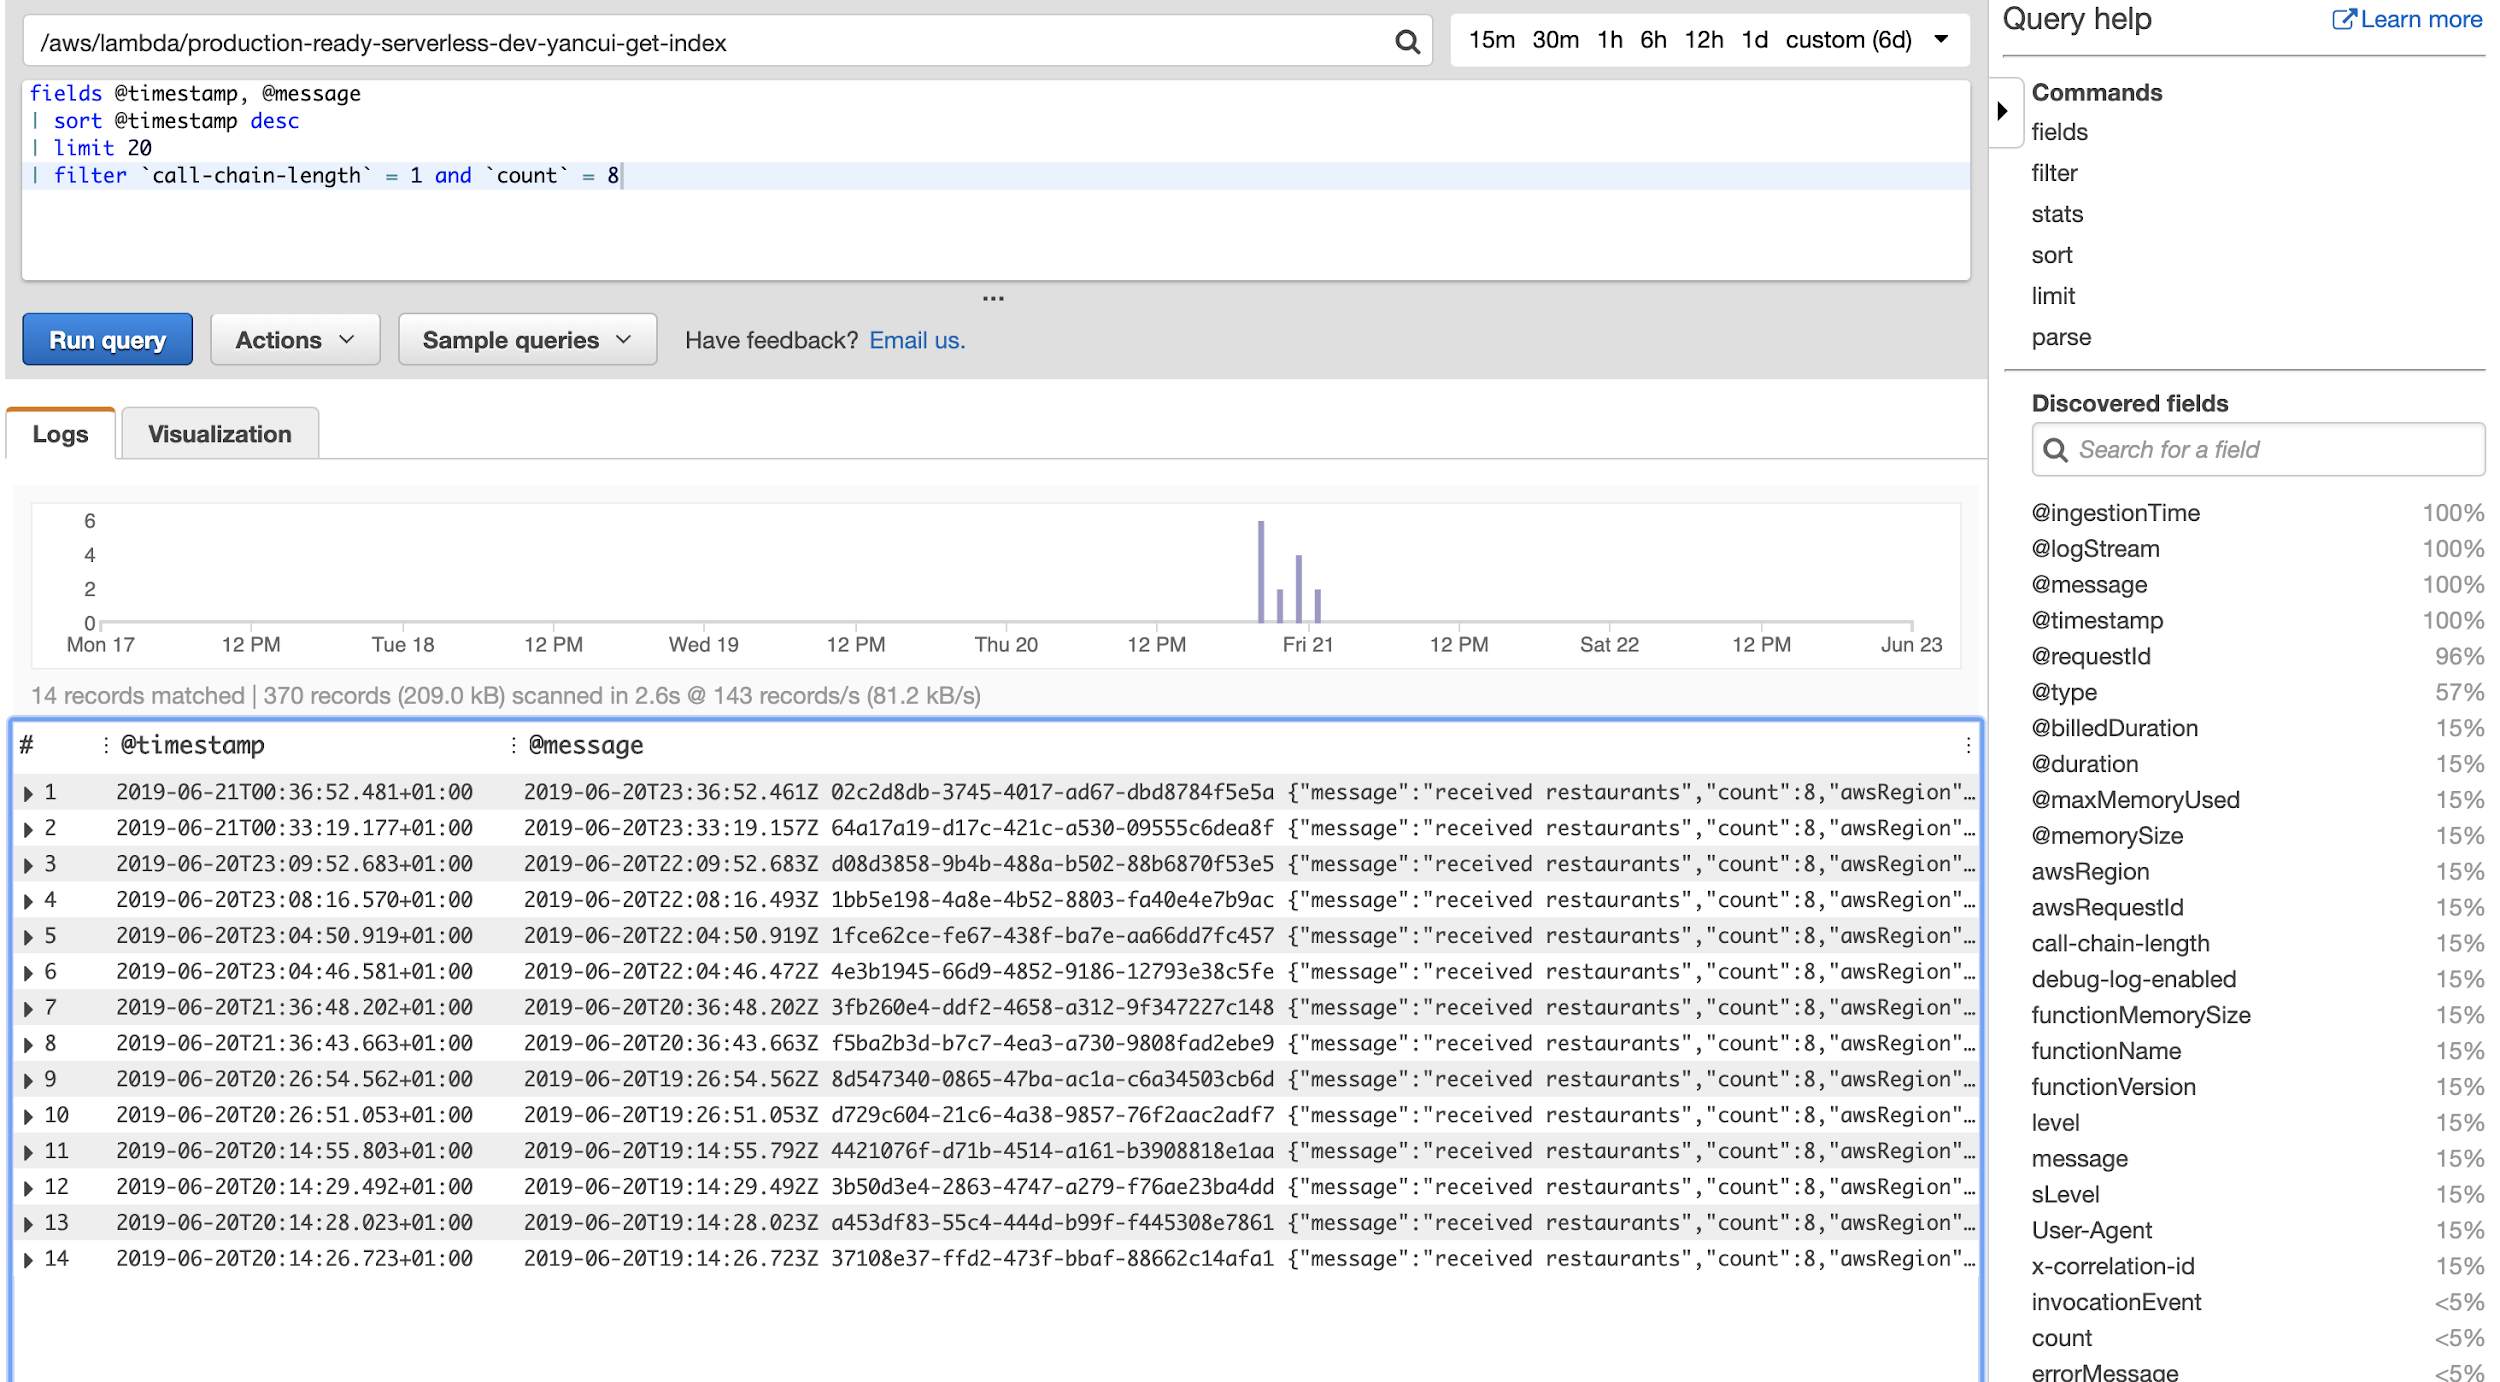
If you’re using structured JSON logs, you can use CloudWatch structured logs to discover fields in your JSON message. You can reference these fields in your query, just as you would do in an ELK stack.
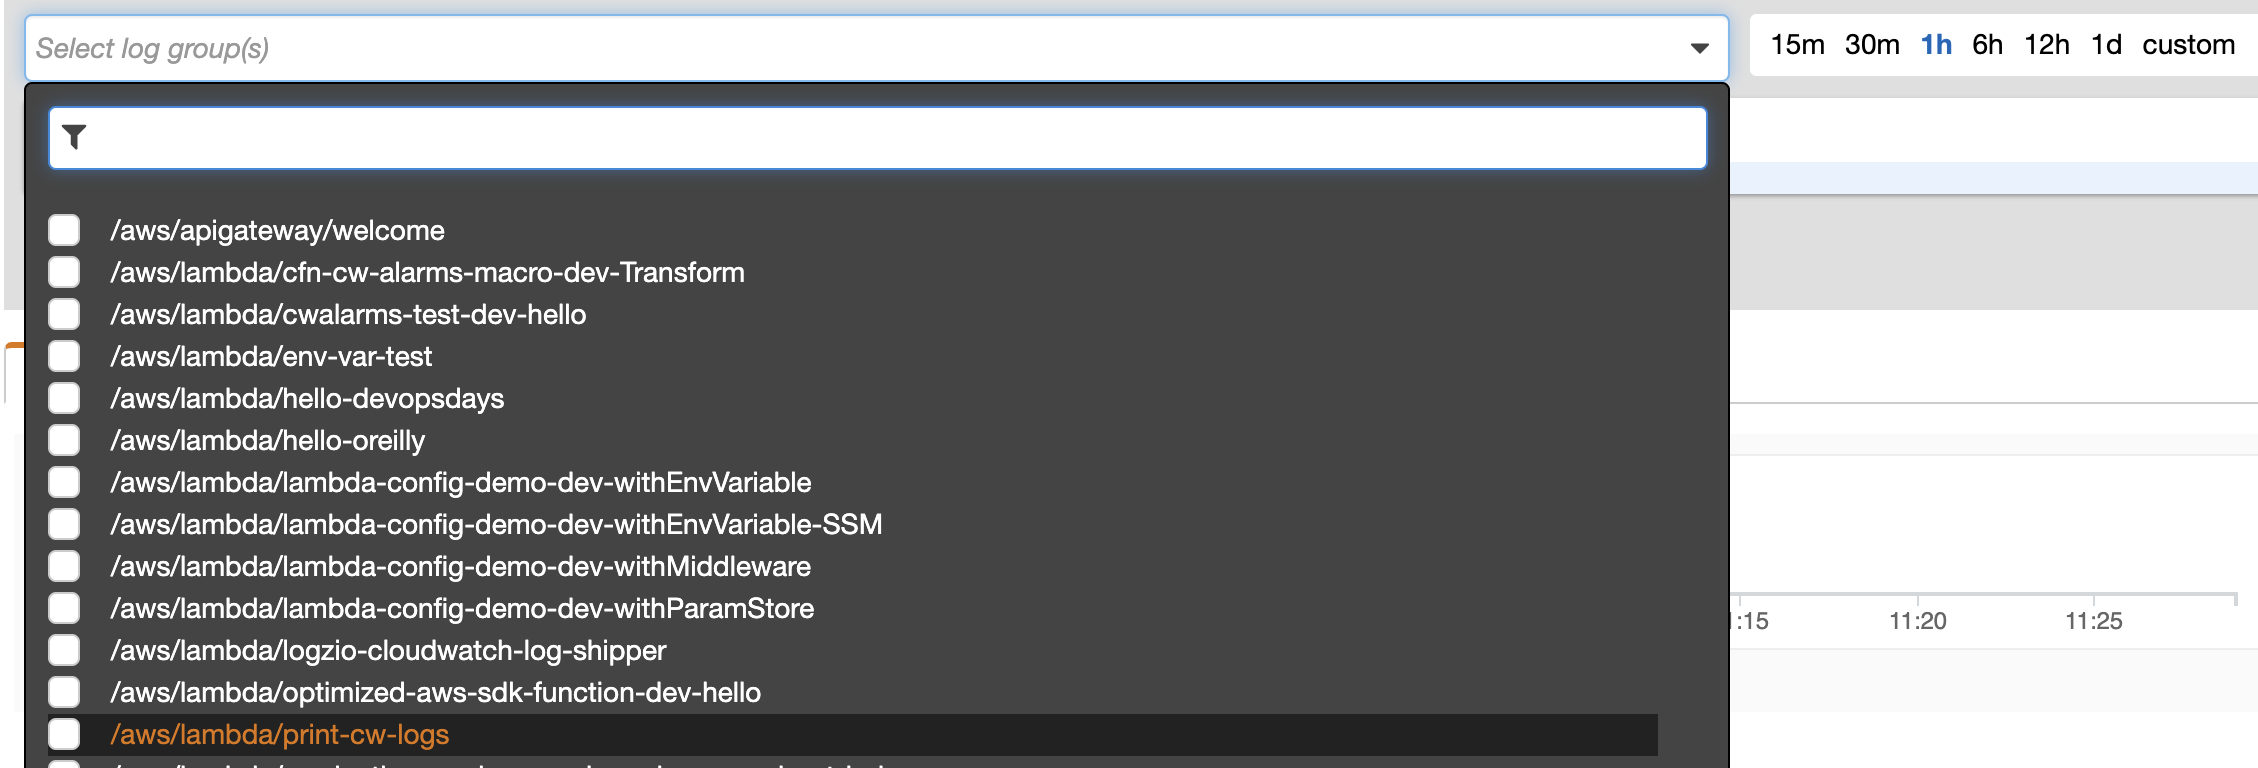
Recently, AWS also added the ability for you to query multiple log groups at once. This brings CloudWatch Logs Insights much closer to the capabilities offered by ELK.
Limitations
However, there is no option to select all log groups at once (I assume it’s to avoid creating costs for AWS’s customers).
That said, it can still be very useful for understanding the behavior of a function, once you have somehow pinpointed which function to investigate.
Another limitation with CloudWatch Logs Insights is that it only operates against logs recorded in the current account. Many organizations operate with multiple AWS accounts, perhaps one account per team per environment. Where each team has autonomy over the services running in its account(s), these services often depend on one another and exchange messages. There is currently no way to query all the logs across account boundaries without implementing some mechanism to aggregates logs from all these accounts.
Summary
In this post, we took a deep dive into AWS CloudWatch Logs and explored its many features:
- Subscription filter for streaming log events to a CloudWatch log destination in real-time
- Metric filter for creating CloudWatch Metrics from log events
- CloudWatch Logs Insights for analyzing log messages using ad-hoc queries
We also discussed the limitations with these features and CloudWatch Logs in general.
You should also consider adopting good logging practices, which are not specific to CloudWatch Logs. One of the easiest and most effective things you can do to make your logs more useful is to write structured logs.
Many people spend more on CloudWatch Logs in production than they do on Lambda invocations. To keep the cost of logging in check, you should not be logging at debug level in production. Instead, you should sample debug logs in production for a small percentage of transactions.
To make following these good practices easy, I built and open-sourced the dazn-lambda-powertools while I was at DAZN. Its logger and middlewares support structured logging, correlation IDs, and sample debug logs out-of-the-box. In fact, you can even sample debug logs for the entire transaction that spans across multiple functions.


