


Effectively monitoring Kubernetes environments remains one of the most challenging aspects of modern application management. As applications grow more complex and distributed, the need for comprehensive visibility becomes paramount.
We have continued to deliver major advancements in our Kubernetes monitoring, providing you with deeper insights and more powerful tools to tackle these challenges head-on.
Our Kubernetes Difference
Before diving into our recent advancements, it’s worth highlighting what sets Lumigo’s Kubernetes monitoring apart:
- Ease of deployment: Our operator-based approach simplifies instrumentation
- Comprehensive payloads: Complete coverage across metrics, logs, and traces
- Trace completeness: End-to-end visibility across your entire application landscape
- Cost advantage: Particularly beneficial for Kubernetes workloads with our focus on logs and metrics
One-Command Deployment Simplifies Onboarding
One of our most significant improvements is the new Kubernetes operator install command. This enhancement dramatically simplifies getting started with Lumigo:
# One command to set up comprehensive monitoring
helm repo add lumigo https://lumigo-io.github.io/lumigo-kubernetes-operator && \
helm repo update && \
echo "
cluster:
  name: <cluster name>
lumigoToken:
  value: <Lumigo token>
monitoredNamespaces:
  - namespace: <namespace>
    loggingEnabled: true
    tracingEnabled: true
" | helm upgrade -i lumigo lumigo/lumigo-operator --namespace lumigo-system --create-namespace --values-
With this single command, you can:
- Install the Lumigo operator in your cluster
- Send all infrastructure metrics from your cluster
- Select specific namespaces to send logs and traces
No more manual CRD creation for each namespace—the command handles everything automatically. This dramatically reduces the time to value, letting you focus on insights rather than instrumentation.
Enhanced Visibility: New and Improved Dashboard Experiences
We’ve significantly expanded our Kubernetes support in Lumigo to give users deeper visibility and a more intuitive troubleshooting experience. Here’s what’s changed and what’s coming.
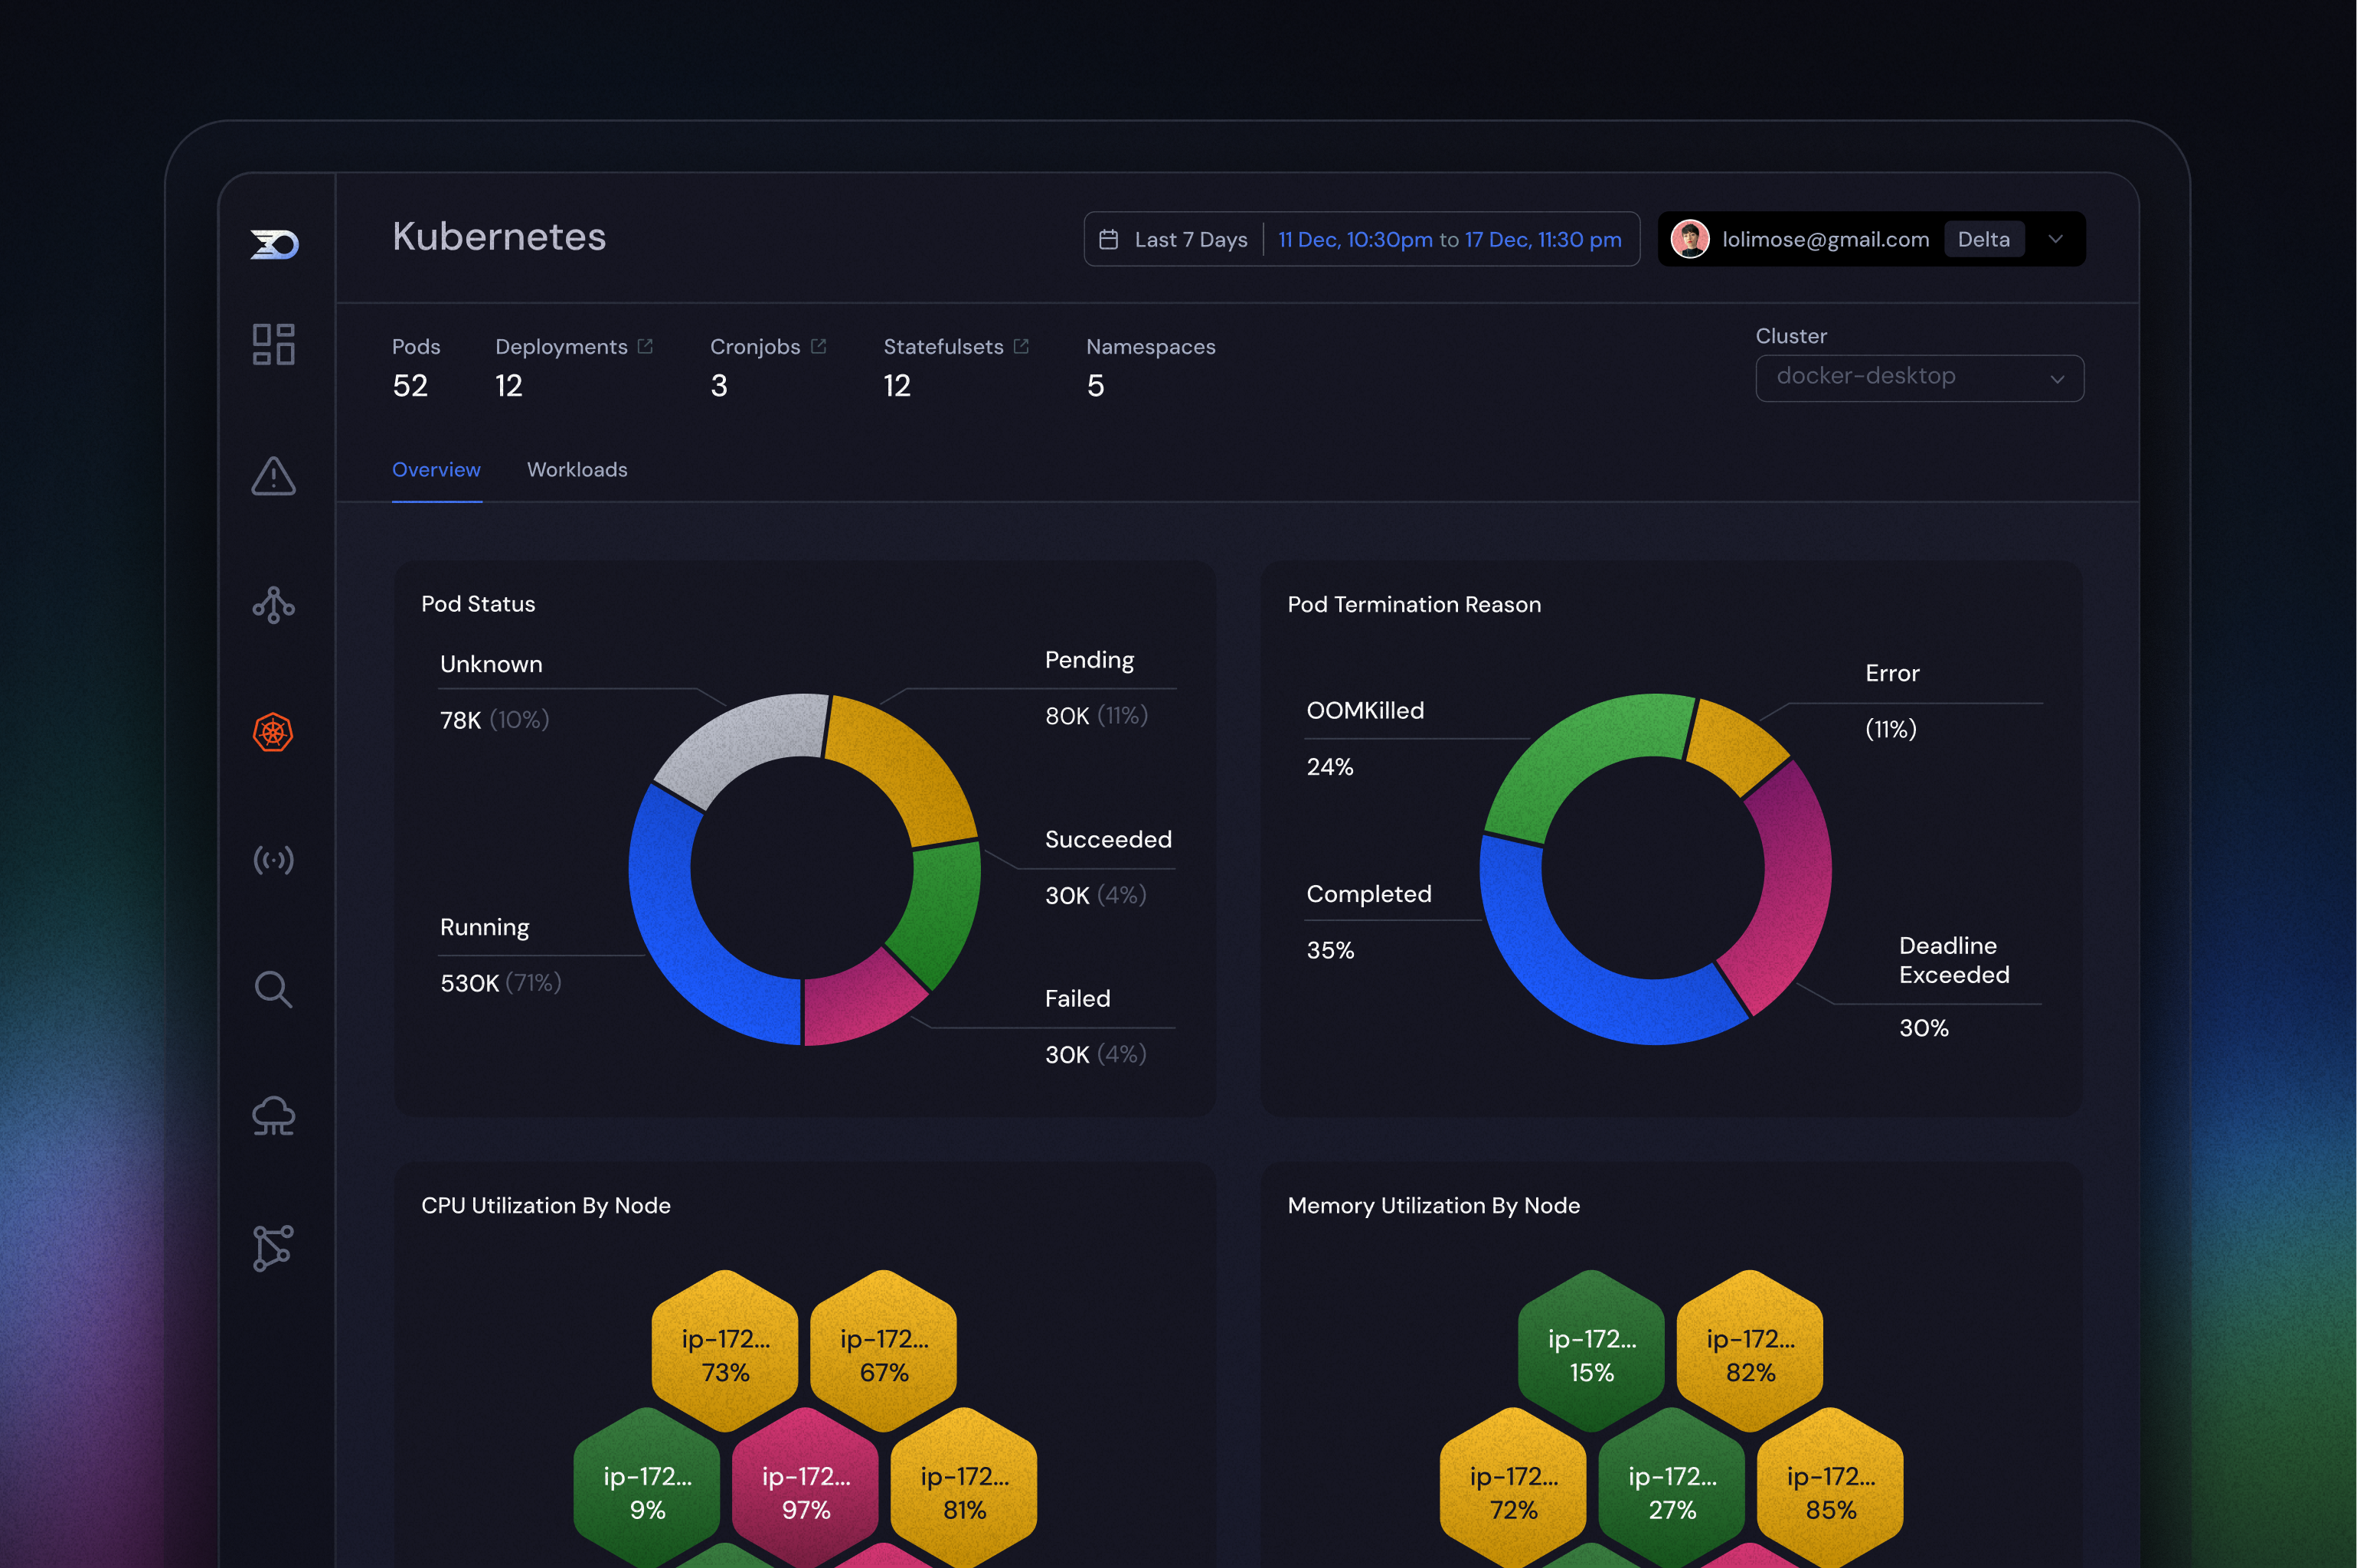
Cluster-level visibility
At the top level, you’ll find comprehensive views across your entire Kubernetes cluster:
- Get a snapshot of your cluster’s health with key metrics like CPU/memory usage, pod count, and node status.
- Drill into the Deployments, Daemonsets, Cronjobs, and Statefulsets running in the cluster.
- Explore all pods at the cluster level, including their health and resource usage.
- Quickly detect and diagnose operational issues such as warnings, failures, and scheduling problems with Kubernetes events
Workload-level pages
Every workload now has its own dedicated page, giving you focused insights into its performance and behavior, which shows all aspects of the workload, including data from Kubernetes metrics, logs, and traces, with links to dive in.
- Monitor the workload’s overall health, resource usage, restart and error logs counts.
- View all pods associated with the workload, along with their individual statuses.
- Track lifecycle events and warnings directly related to the workload.
- Based on trace data, you can view correlated issues and errors detected by Lumigo, like failed transactions or elevated latencies.
Pod-level insights
Drill down from workloads to the pod level with a complete view of performance and health.
- The same key metrics, now focused on individual pods.
- Real-time status for every container within the pod.
- Pod-specific events and metrics for faster troubleshooting.
- Trace-based application issues detection of pod-level errors and latencies.
Precision Monitoring with Enhanced Operator Support
Label-Based Resource Selection
Version 66 of our Kubernetes operator introduced a game-changing capability: label-based resource selection for monitoring. This addresses one of the most common challenges in complex environments—the ability to precisely target specific resources without instrumenting entire namespaces.
Now you can:
- Use Kubernetes labels to select exactly which resources to monitor
- Implement fine-grained monitoring in shared namespaces
- Adapt to complex architectures with diverse workload requirements
All-Namespace Monitoring
Version 44 introduced another significant enhancement, allowing users to monitor all cluster namespaces simultaneously. By simply setting monitoredNamespaces=all, you can enable traces and logs across your entire cluster—perfect for development environments or initial investigations.
Resource Optimization
Understanding the importance of cost efficiency, we’ve also refined our metrics collection. The operator version 44 sends only essential infrastructure metrics by default, reducing noise and preventing unnecessary expenses while still providing critical visibility.
Kubernetes Event Issue Page
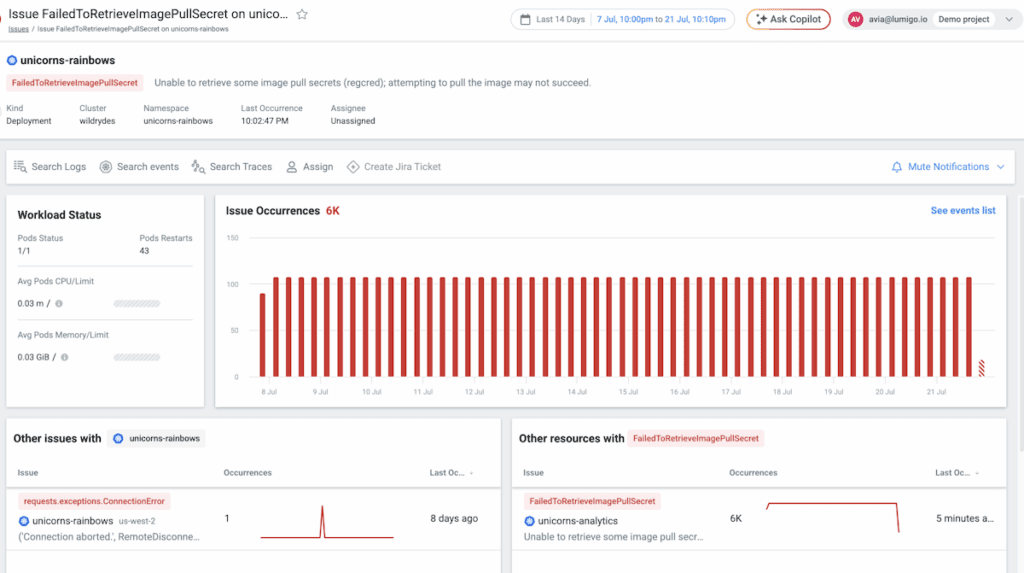
A new Kubernetes Event Issue Page enables you to quickly understand recurring Kubernetes issues by displaying error frequency over time, along with key metrics such as CPU, memory, and pod statuses for the affected object.
Assess the blast radius by seeing which other issues impacted the same object or which other objects experienced the same error.
Alert Templates for Faster Remediation
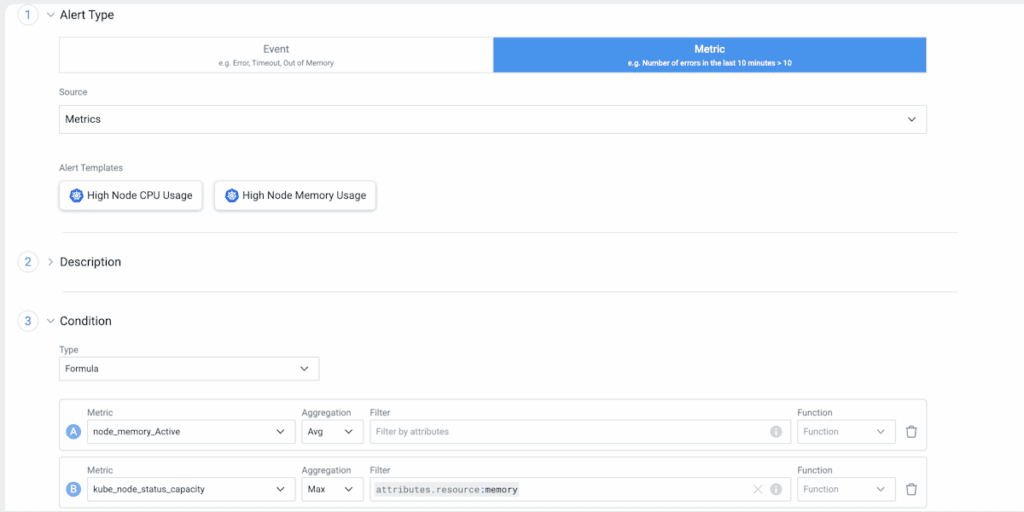
Set up alerts on critical Kubernetes metrics—like high node CPU or memory usage—in just a few clicks. Simply pick a template, and Lumigo automatically configures the alert for you, eliminating the need to define metric formulas by hand.
Get Started
For DevOps and Developers, Lumigo means faster troubleshooting and more efficient resource utilization. Our approach delivers better data through intuitive interfaces that support how modern teams actually work. Ready to experience the difference? Try Lumigo’s Kubernetes monitoring by installing the operator.