 All Resources
 Docs
Docs Blog
Blog Guides
Kubernetes Troubleshooting
- Topics
Kubernetes Troubleshooting: 5 Common Errors & How to Fix Them
What Is Kubernetes Troubleshooting?
Kubernetes troubleshooting involves identifying, investigating, and resolving issues within a Kubernetes cluster. This can involve investigating problems with containerized applications, the control plane, or the underlying infrastructure.
While Kubernetes troubleshooting is complex, by employing best practices, log analysis, and automated tools, administrators can effectively pinpoint and address issues to ensure a reliable, high-performing Kubernetes environment.
Why Is Kubernetes Troubleshooting Difficult?
Kubernetes troubleshooting is complicated due to several factors:
Production environments in Kubernetes can be highly complex, with numerous interconnected components such as containers, nodes, and services working together to form the overall system. This intricate architecture makes it challenging to pinpoint the exact root cause of issues and requires deep expertise to effectively diagnose and resolve problems.
In addition, Kubernetes clusters often host multiple microservices built by different teams. Each team may follow unique development methodologies, use various programming languages, and have distinct dependencies. This diversity makes it difficult to maintain consistency across the cluster, leading to potential conflicts and problems that can be hard to troubleshoot.
To tackle these challenges, close coordination among development, operations, and security teams is essential. Establishing clear lines of communication and collaboration helps ensure that issues are identified and resolved more efficiently. Additionally, using appropriate tools, such as monitoring and observability platforms, can aid in detecting anomalies and providing insights into the cluster’s health.
5 Common Kubernetes Errors and How to Troubleshoot Them
Here are some of the main errors you might encounter in Kubernetes, and quick advice for how to resolve them.
CrashLoopBackOff
The CrashLoopBackOff message indicates that Kubernetes was unable to schedule a given pod on a node. This error occurs when the node lacks the necessary resources to run the pod, or the required volumes failed to mount.
Identifying the error
You can identify this error by using the kubectl get pods command. The affected pod should show a CrashLoopBackOff status. 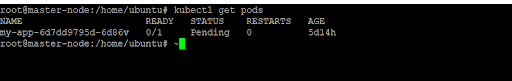
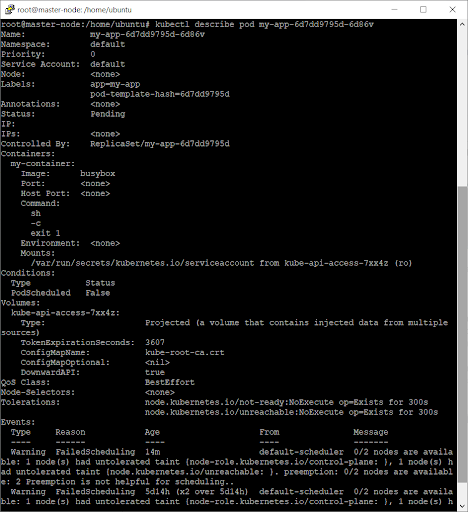
You can view details about the pod to further investigate the error by using the kubectl describe pod
Resolving the error
Here are some of the main causes of the CrashLoopBackOff error and how to address them:
- Lack of resources: If the node lacks the required resources, you can manually eject some of its existing pods from or scale up the cluster to ensure more nodes are available for the pods.
- Volume mounting errors: If there was a problem when mounting the storage volume, you can check the volume’s manifest to ensure its definition is correct. You should also verify that a storage volume exists matching this definition.
- Pods bound to a hostPort: When using a hostPort, only one node can be scheduled for each node. You can usually avoid this by using a Service object instead of a hostPort to enable the pod to communicate.
ImagePullBackOff
This status indicates that the pod could not start on the specified node and Kubernetes was unable to pull the container image (thus the status refers to ImagePull). The BackOff element in the message indicates that Kubernetes will continue to try and pull the image.
Identifying the error
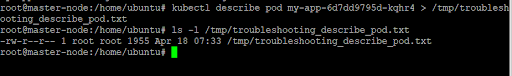
To troubleshoot the ImagePullBackOff error, run the kubectl describe pod command to collect information about the pod and save the output to a text file: /tmp/troubleshooting_describe_pod.txt
Next, check the Events section in the describe command’s output. Look for one of these messages in the text file:
-
Repository ... does not exist or no pull access
-
Manifest ... not found -
authorization failed
Resolving the error
If the error message is Repository … does not exist or no pull access, it indicates that the Docker registry used by the cluster does not contain the pod’s specified repository. Kubernetes pulls images from Docker Hub by default, but the specific cluster could be using a private registry. Sometimes, this error occur because the repository name specified by the pod is incorrect.
This error can be resolved by checking the pod’s specification and ensuring that the image and repository are correctly defined. If the error remains unresolved, the cause could be a network issues that is blocking access to the registry. In this case, check the node’s hostname in the pod description (text file) and download it manually.
If the error is Manifest ... not found, Kubernetes couldn’t find the specific version of the container image. The specified tag might be incorrect, so you should check that it is correct and is included in the repository.
If the message is authorization failed, the credentials provided when requesting an image or container registry failed to authorize. You can resolve this by creating a secret with the correct credentials and referencing it in the pod’s specification. Make sure the secret’s credentials have the necessary permissions to access the image or repository.
Exit Code 1
This error indicates that the container was terminated due an application error or invalid reference:
- Application errors can be programming errors or more complex errors related to the runtime environment (i.e., Java, Python).
- Invalid references can occur when the image spec refers to a file that doesn’t exist in the container image.
Resolving this error
To address an Exit Code 1 error, verify that all files defined in the image spec exist in the container log. If one of the files is missing, this indicates an invalid reference. You can modify the image specification to point to the appropriate file, specifying the right path and name. If you cannot identify an invalid reference, check for application errors and debug the affected library.
Exit Code 125
The Exit Code 125 error code occurs when a container fails to run because the command invoked by Kubernetes in the system shell didn’t execute properly. For instance, you might try to execute the docker run command but fail. This error is often caused by the following:
- One of the users listed in the image spec doesn’t have the appropriate permissions.
- The container engine is not compatible with the host’s operating system or hardware.
Resolving the error
To address this error:
- Check if the attempted command’s syntax is correct.
- Check if the user trying to run the container has the necessary permissions.
- Look for alternative options by running other similar commands from the container engine. For instance, you could substitute docker start for docker run.
- Check if the same username and context can be used to run another container on the host. If the host cannot run other containers successfully, you might need to reinstall the container engine.
Kubernetes Node Not Ready
A node displays a NotReady status when it shuts down or crashes and the stateful pods inside it are unavailable. If this error persists for longer than five minutes, the status of the scheduled pods will become Unknown. Kubernetes will then attempt to reschedule the pods on a different node, assigning it a status of ContainerCreating.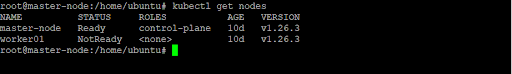
Identifying the error
You can identify the affected pods using the kubectl get pods command. You can check if the scheduled pods have been moved to other nodes by using the get nodescommand and seeing if the output shows the same pod on more than one node.
Resolving the error
Sometimes, this issue resolves itself when the failed node recovers, or if you reboot it. When the node recovers, it joins the cluster and the pod with the Unknown status is deleted. Kubernetes detaches the failed node’s volumes. Once the pod is rescheduled on another node, Kubernetes attaches the necessary volumes and its status will become ContainerCreating. After a default, five-minute waiting period, the status should switch to Running.
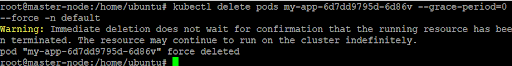
However, you may need to guide Kubernetes to reschedule the stateful pods on a new node if the failed node doesn’t recover in time. You can do this by removing the failed node with the kubectl delete node. Alternatively, delete the stateful pods with an Unknown status by using the following command:
kubectl delete pods pod-name --grace-period=0 --force -n example-namespace</code>
Kubernetes Troubleshooting with Lumigo
Lumigo is a troubleshooting platform, purpose-built for microservice-based applications. Developers using Kubernetes to orchestrate their containerized applications can use Lumigo to monitor, trace and troubleshoot issues fast. Deployed with zero-code changes and automated in one-click, Lumigo stitches together every interaction between micro and managed service into end-to-end stack traces. These traces, served alongside request payload data, give developers complete visibility into their container environments. Using Lumigo, developers get:
- End-to-end virtual stack traces across every micro and managed service that makes up a serverless application, in context
- API visibility that makes all the data passed between services available and accessible, making it possible to perform root cause analysis without digging through logs
- Distributed tracing that is deployed with no code and automated in one click
- Unified platform to explore and query across microservices, see a real-time view of applications, and optimize performance
To try Lumigo for Kubernetes, check out our Kubernetes operator on GitHub.